¶ Reports
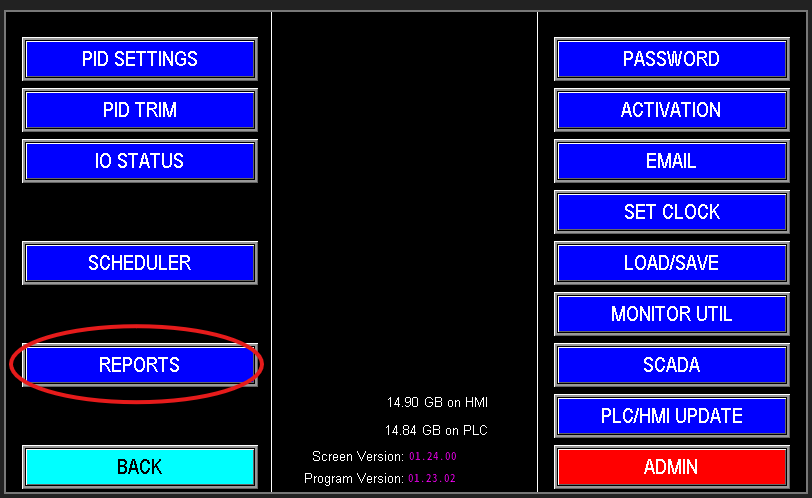
The Reports tab tracks water usage through the station for operational monitoring or regulatory reporting (image 1.1). It displays daily totals and historical data for previous days, making it easy to review consumption trends. Report data can be exported or emailed to stakeholders as needed.
¶ Monthly Totals Screen
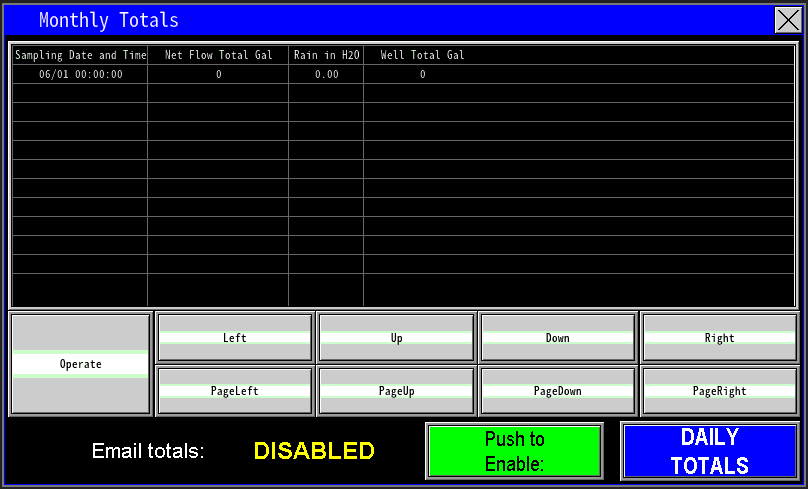
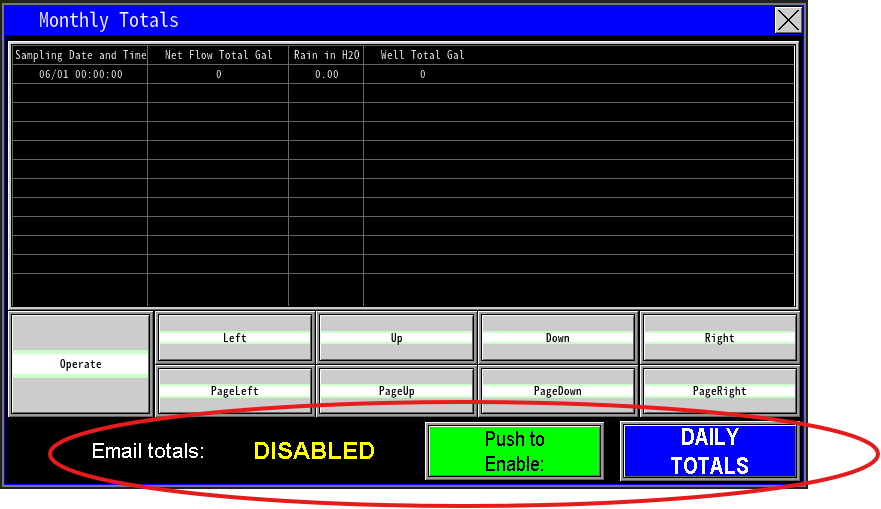
This screen (image 1.2) displays monthly water usage totals. It presents the total flow for each month and, where applicable, includes separate totals for well flow. If a rain gauge is installed, monthly precipitation totals are also recorded.
¶ Operate
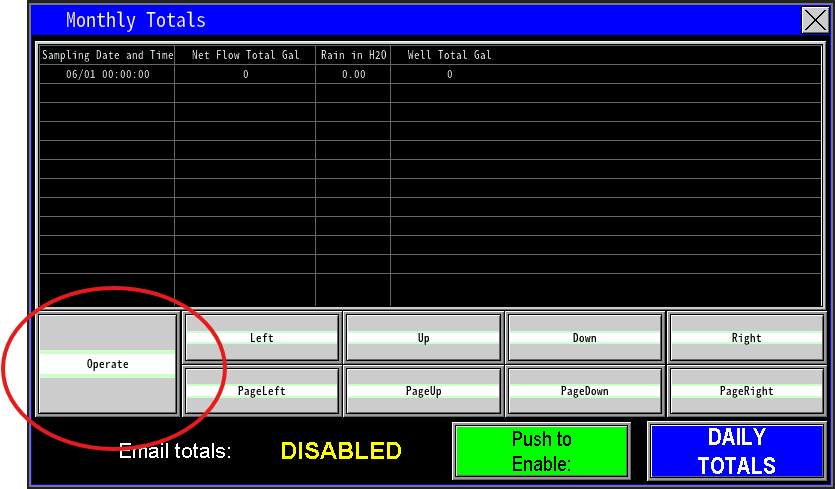
The Operate button (image 1.3) enables interaction with the navigation and command keys. When “Operate” is displayed, navigation and command keys are locked. Pressing the Operate button clears the label and unlocks the screen, allowing navigation with the arrow and command keys.
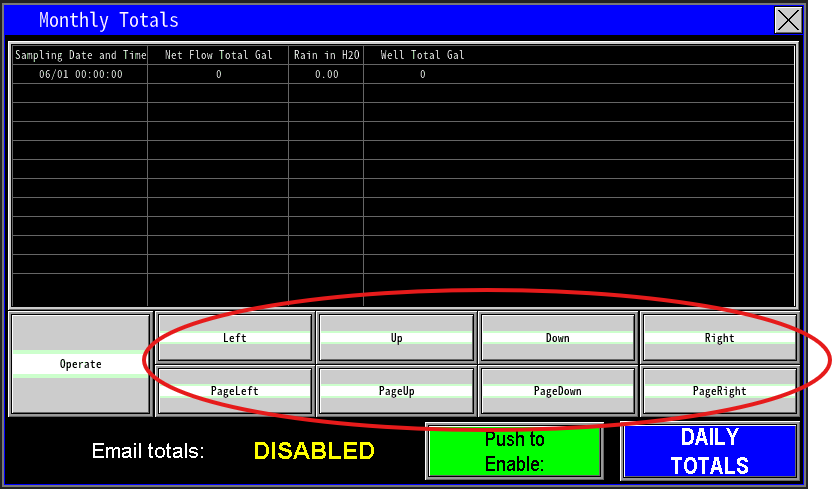
The other buttons next to the operate button allow for navigation of the total lists (image 1.4).
The lower portion of the screen (image 1.5) displays whether automated reporting is enabled or disabled, and provides access to the Daily Totals report. When reporting is enabled, the system will automatically email summarized flow totals by day and by month to designated recipients.
¶ Daily Totals
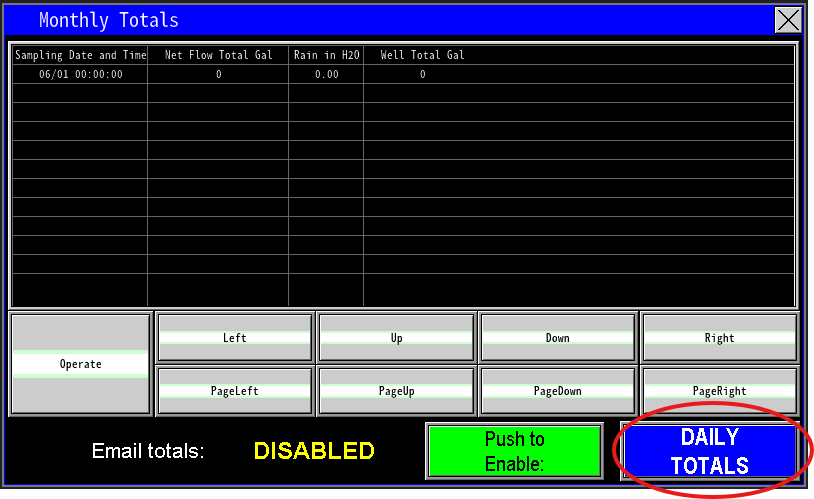
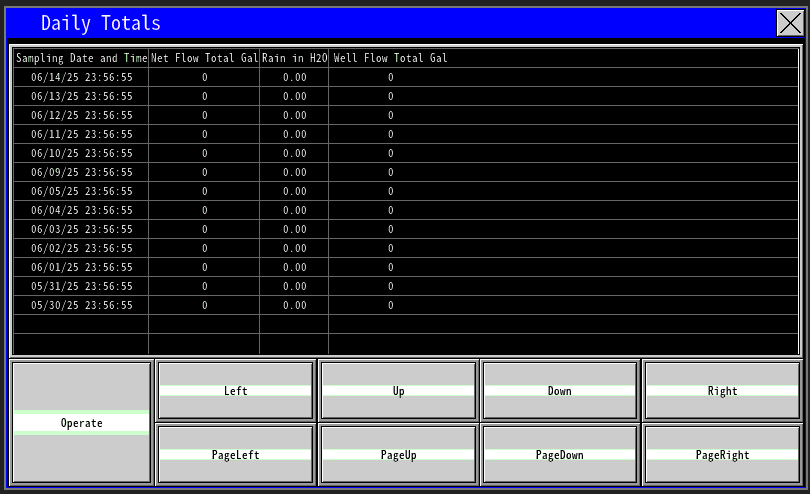
Select the Daily Totals button in the bottom‑right corner (Image 1.7) to open the Daily Totals screen (Image 1.8). This view provides the same flow information as the Monthly Totals screen but displays it broken down by individual days instead of by month.
|
|