¶ Faults Screen
The Fault Screen provides a comprehensive historical record of faults that have occurred within the pump station, enabling operators to track, analyze, and resolve issues effectively. This section is designed to assist in diagnosing system problems by organizing fault data into distinct categories and offering navigation and diagnostic tools. Proper use of this screen ensures timely identification and correction of operational faults, maintaining system reliability.
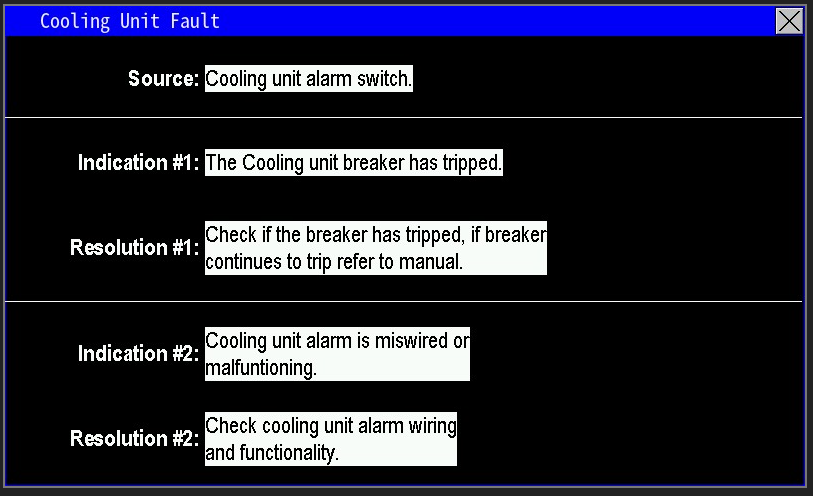
The Fault Screen (image 1.1) is divided into three primary data sections, with additional navigation controls located below the fault list.
¶ Fault Data Sections
- Occurrence:
- Records the date and time when each fault was detected.
- Provides a chronological reference to pinpoint when the fault occurred, aiding in correlating events with operational conditions.
- Message:
- Displays the name of the fault (e.g., Low Pressure, Pump Overcurrent).
- Identifies the specific issue, allowing operators to quickly recognize the nature of the fault for further investigation.
- Recover:
- Indicates the date and time when the fault was manually reset or auto-reset by the system.
- Tracks the resolution timeline, helping operators verify when normal operation was restored.
¶ Navigation Controls
Below the fault list, the following buttons facilitate interaction with the fault data:
- Select:
- Enables selection of a specific fault from the list for detailed review.
- Highlights the chosen fault, preparing it for diagnostic analysis or other actions.
- Up and Down:
- Provides scrolling functionality to navigate through the fault list.
- Allows operators to move to previous or subsequent faults, ensuring access to all recorded events.
- Diagnose:
- Appears after selecting a fault, opening a detailed description of the occurrence.
- Offers operator guidance by providing common troubleshooting suggestions and potential fixes specific to the selected fault, enhancing resolution efficiency.
- Clear:
- Erases all faults currently displayed in the fault list.
- Permanently removes selected fault records. Use with caution, as cleared data cannot be recovered.
Alternative Selection Method
- In addition to using the “Select” button, operators can choose a fault for investigation by directly pressing the fault message in the list.
- Once selected, proceed by clicking the “Diagnose” button to access the associated diagnostic information as described above.
¶ Diagnose
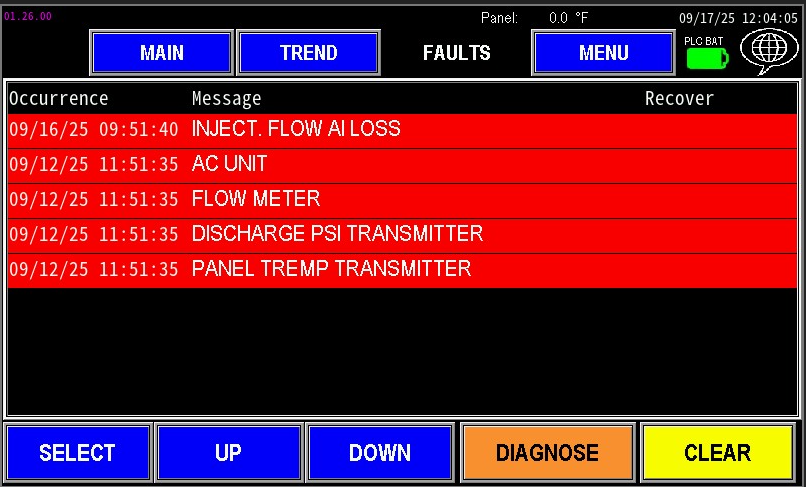
The Diagnose button provides detailed fault insights. Pressing it brings up the Diagnose screen (image 1.2), which offers guidance on resolving the issue.
- Source: The current fault identified
- Indication(s): Possible causes of the fault
- Resolution(s): Suggested actions to fix the problem