Welcome To Omnia
Omnia is a highly adaptable program designed to empower end users to effortlessly update their pump stations without requiring custom programming. Unlike traditional automation systems with rigid, predefined I/O configurations, Omnia offers dynamic I/O flexibility, enabling seamless adjustments as the station evolves. This will maximize the efficiency and performance of your pump system with ease.
We're continuously enhancing this dynamic program to better serve you, our valued customer. Your feedback is invaluable in helping us refine and improve both the program and its supporting manual. Please share your suggestions here, and thank you for your ongoing support!
Omnia Updates
Stay informed about the latest Omnia updates! Check the end of this manual for details on when new program enhancements are released. Want to shape future updates? Submit your feature requests via the hyperlink below, and we’ll work to include them in the next Omnia update, ensuring your pump station remains cutting-edge.
Internal Use Manual
System Architecture
Pressure Maintenance
A Pressure Maintenance Pump Station is designed to ensure consistent pressure within a fluid system, such as a water supply, irrigation, or industrial process. Here's how it generally works:
- Monitoring Pressure: The station continuously monitors the system's pressure using sensors or gauges.
- Activation of Pumps: When the pressure drops below a preset level, the pump station activates one or more pumps to increase the pressure.
- Maintaining Pressure: The pumps operate to maintain a steady pressure, compensating for demand changes or pressure losses due to leaks or other factors.
- Control System: The Omnia program intelligently manages pump operation, cycling pumps on/off to optimize efficiency and prevent over-pressurization.
The Omnia Program utilizes just about every type of component imaginable when requiring a pressure maintenance system all under one dynamic program.
Pump Down
A Pump Down Pump Station is typically a type of pump station used in various applications such as wastewater, stormwater, or industrial fluid management. The term "pump down" refers to the process of lowering or removing fluids from a confined space, system, or area.
How it works:
- Purpose: The main goal is to pump fluid out of a confined space or affected area to prevent overflow, manage flow, or prepare for maintenance.
- Operation: The pump station activates pumps to draw fluid from the collection point or basin and transfer it to a main sewer line, treatment facility, or designated safe location.
- Control: It often includes sensors and control systems to monitor fluid levels, ensuring pumps operate only when necessary.
Typical applications:
- Pumping out septic tanks or sumps.
- Managing stormwater during heavy rainfalls.
- Industrial systems where fluid levels need regulation.
In essence, a Pump Down Pump Station is a system designed to efficiently remove fluids from a specific area to maintain safety, control flow, or prepare for further processing.
Destination Fill
A Destination Fill Pump Station is a specialized system designed to transfer or fill a container, Tank, or vessel to a specific "destination" point, often as part of a larger process or operational workflow. These stations are commonly used in industries like chemical processing, water treatment, tank farms, or pond fill.
How it works:
- Purpose: To accurately fill a specified tank or container to a predetermined level or volume.
- Operation: The pump station is controlled via sensors or automation systems to ensure the target volume or level is achieved precisely.
- Control Systems: Often includes flow meters, level sensors, or automated controls to monitor the fill process, preventing overfill or underfill.
- Flow Paths: It’s configured to direct fluid from a source (like a pipeline, bulk tank, or processing line) directly to the destination tank or vessel.
Typical applications:
- Filling reservoirs or tanks in water treatment plants.
- Chemical or fluid transfer operations.
In summary, a Destination Fill Pump Station ensures the safe, accurate, and controlled filling of fluids into designated containers or systems, optimizing efficiency and safety in fluid handling processes.
Main Operations
The control panel's operations and automations are fully tailored to the specific configuration of your pump station. While this manual covers all features within the Omnia program, not all may apply to your station's unique setup. Familiarize yourself with your pump station's components to better understand how the control panel and touchscreen interface drive its automation. For a concise overview of the touchscreen, refer to the link below.
Screen Navigation
Main Screen
The main screen serves as the central hub for all operations, providing end users with a clear view of the pump station’s status, including its pumps and components. Mastering navigation of this screen is key to efficiently operating the system and making necessary adjustments. This section offers a basic overview of the information displayed. For detailed guidance on interpreting this data and operating the station, refer to this Omnia Manual.
As Omnia is a dynamic program, the main screen’s appearance varies depending on the configuration package purchased with your station, which determines the available options and data displayed. Note that Image 1.1 and all other images in this manual are for reference only and may not exactly match your setup.
Navigation Note: Any blue button on the main screens is a "Go To" button. Clicking these buttons will open a pop-up screen with settings related to the button’s label, allowing you to access and adjust specific features.
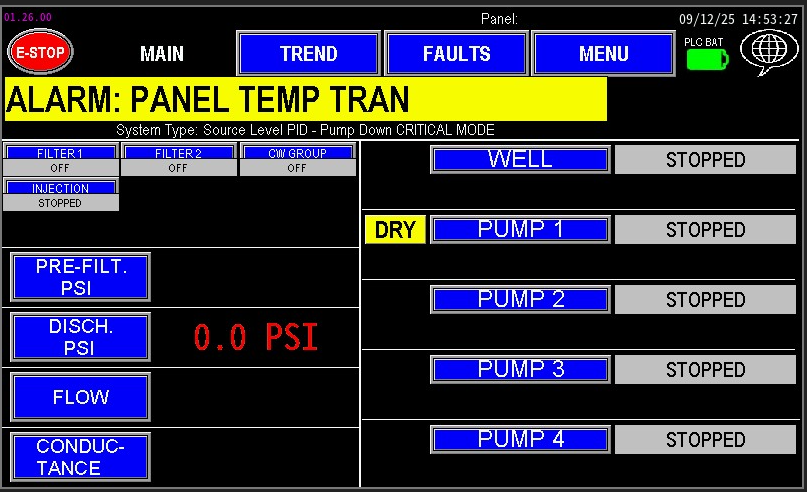
1.1 Main Screen
Trend Screen
An analytical interface providing graphical representations of historical and real-time data, such as pressure, flow, and motor speed trends. This screen (image 1.2) enables operators to analyze system performance over time for optimization and troubleshooting.
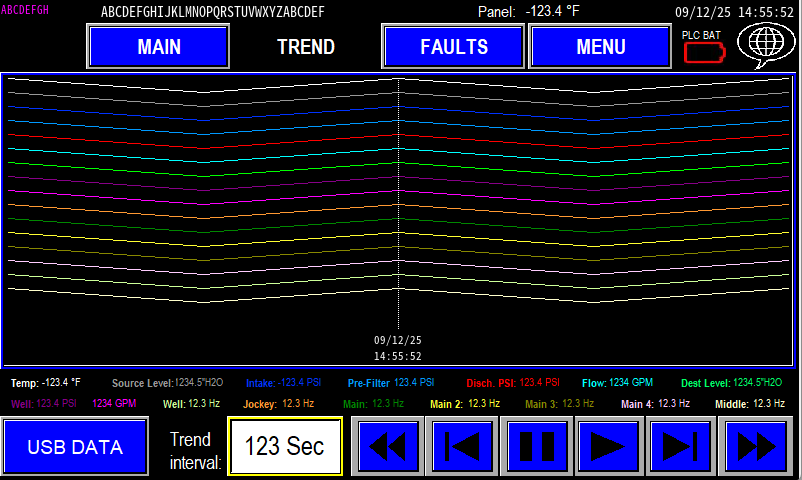
1.2 Trend Screen
Faults Screen
The fault screen (image1.3) displays the fault history and any current faults within the station. Faults are listed with timestamps, descriptions (e.g., high-pressure switch triggered, pump over-temperature), and severity levels, aiding in diagnostics and maintenance planning.
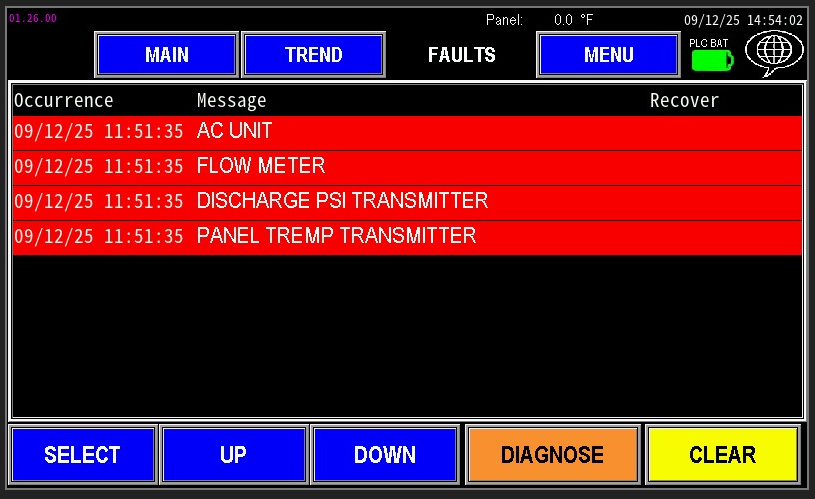
1.3 Faults
Menu Screen
The Menu screen (image 1.4) provides access to pop-up configuration screens for all automation categories, including pump controls, VFD parameters, alarm settings, and system calibration. Each pop-up is designed for intuitive navigation and precise adjustments.
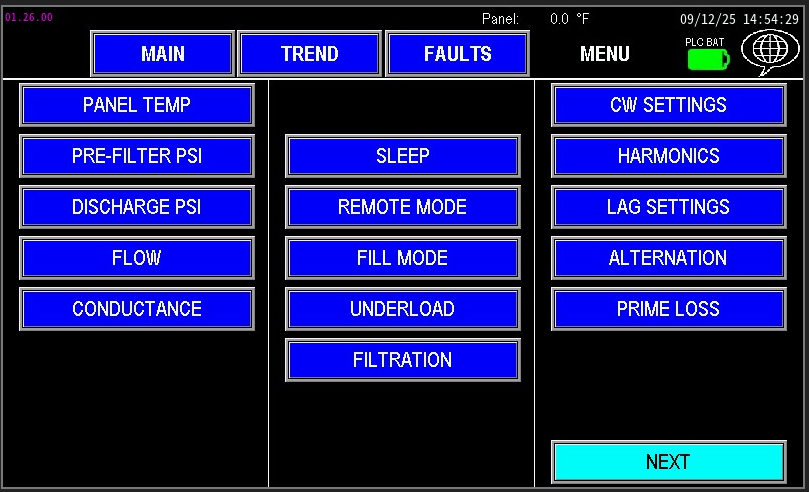
1.4 Menu Screen
Pump Operations
This section provides comprehensive details on configuring any pump within the automation system. While some settings are consistent across different pumps, each pump may respond uniquely. To ensure proper setup, familiarize yourself with your specific pump station and its controls before making adjustments. Review this manual thoroughly to understand the station’s components and settings for optimal configuration.
Common Pump Settings
These common pump settings are specific to the individual pump that is being adjusted, but the process is the same when adjusting these settings from one pump to the next.
Underload Settings
The Underload setting, accessible via the pump menu settings (Image 1.1) or through the menu screens (Image 1.2), enables monitoring of discrepancies between pump frequency and torque, indicating insufficient water in the pump. This could mean the pump is running dry or not receiving adequate water on the intake side. Familiarize yourself with these settings in the Omnia Manual to ensure proper configuration and effective pump operation.
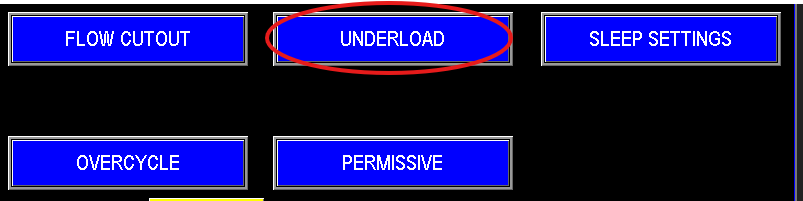 1.1 Underload |
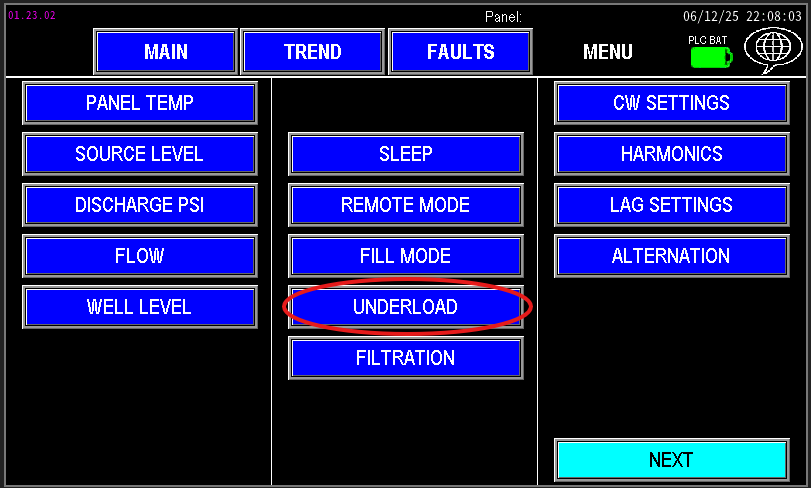 1.2 Menu screen underload |
Jockey Underload
At the top of screen 1.3, shows the current motor data readings the PLC is receiving from the drive. Those readings are Frequency, current, kW, and torque.
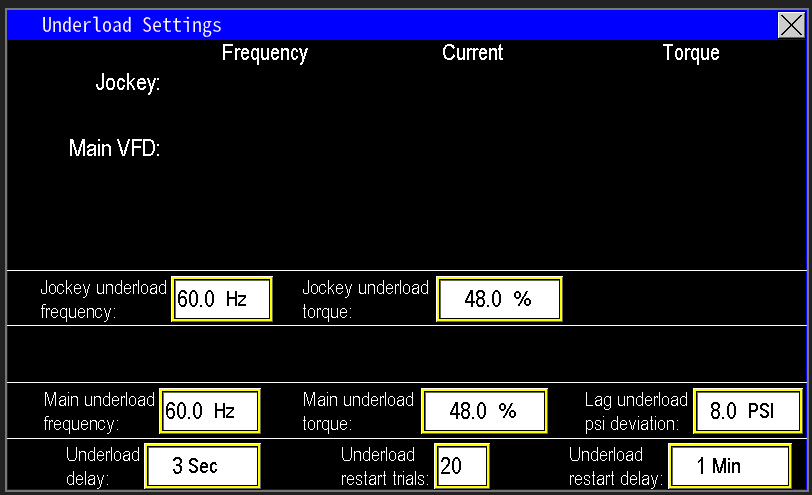
1.3 Underload Screen
In the scenario depicted in Image 1.4, if the Jockey pump operates at 60 Hz with a torque at or below 48%, the PLC will trigger an underload fault for the pump. Image 1.5 displays the underload settings applicable to all pumps in the station. The Underload Delay represents the time between when the PLC detects an underload condition and when it faults the station. Setting this delay as low as possible, without causing false faults, is critical to minimize wear and tear on the pump head.

1.4 Underload parameters
When a pump faults on underload, the PLC initiates an Underload Restart Delay, which determines how long the pump remains faulted before automatically resetting. As shown in Image 1.5, this delay is set to 1 minute but is configurable. If the underload condition persists and the pump faults again, the system will attempt to restart the pump up to 20 times. Should the pump continue to fault after these 20 attempts, it will not restart automatically. At this point, manual intervention at the station is required to diagnose and resolve the issue before operations can resume. Refer to the Omnia Manual for detailed troubleshooting and configuration guidance.

1.5 Underload Resets
Main Pump Underload
The underload functionality for the main pumps operates similarly to the Jockey pump, with the same variables and conditions as described in the previous section. For pumps equipped with a variable frequency drive (VFD), the underload settings are consistent, though setpoints may vary slightly. However, if a main pump lacks a VFD, detecting underload becomes more challenging and is not an adjustable setting without a drive configured.
When a panel is configured to run only the Lead pump with a drive and the rest of the pumps get straight power, Omnia includes a Lag Underload PSI Deviation setting for pumps not controlled by a VFD. Without a drive, the PLC cannot directly monitor motor performance, as it typically relies on drive parameters for this data. Instead, the PLC monitors PSI deviation. If the pump station’s pressure deviates beyond the set Lag Underload PSI Deviation threshold for longer than the Underload Delay, the lag pump will fault on underload. In the example below (image 1.6) the PI threshold is 8psi. This mechanism allows the PLC to protect non-VFD pumps from issues like seal damage or pump failure.

1.6 Underload Parameters
Sleep Settings
The Sleep Settings allow the pump station to automatically slow down and shut off when water demand ceases, as shown in Image 2.6. These settings, accessible via the shared sleep settings screen for the Jockey Pump, Main Pumps, and Intermediate Pumps (Image 2.7), optimize energy, efficiency and system longevity. Pumps can be put to sleep in two primary ways: Sleep by Flow or Sleep by PID Output. Additionally, if the station is configured as a pump-down system, a Sleep by Level setting will also be available, described below under “Sleep By Level” section.
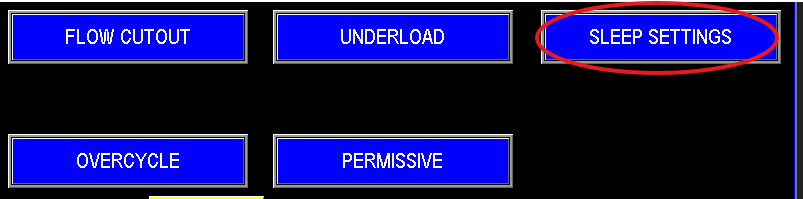 2.6 Sleep |
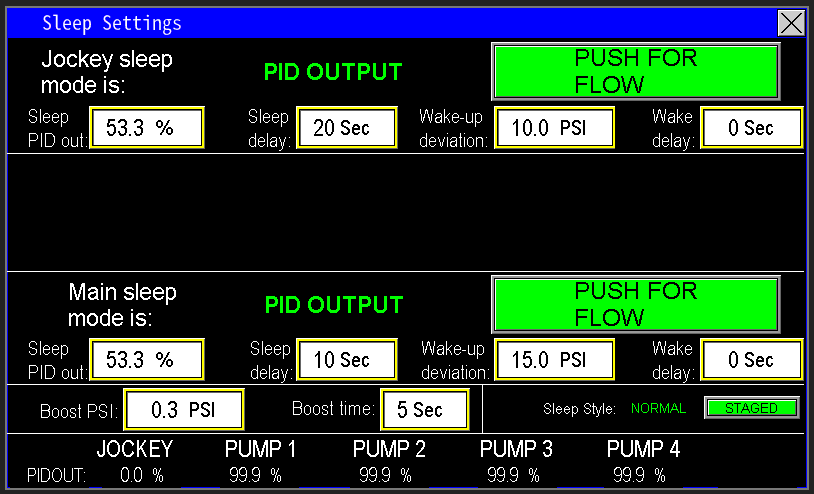 2.7 Sleep settings |
With the Sleep by PID setting (Image 2.8), the PLC monitors its own PID output sent to the variable frequency drive (VFD), as shown in Image 3.0. For example, if the PID output falls below 53.3%, the PLC initiates a 20-second delay timer. Once this timer completes, the Jockey pump enters sleep mode. The Wake-Up Deviation determines when the pump reactivates, based on the difference from the pressure setpoint. When water demand increases, causing the system pressure to drop below the setpoint by 10 psi, the pump is triggered to wake up and resume building pressure. Additionally, a Wake-Up Delay timer can be set to delay the pump’s restart after the wake-up deviation setpoint is met. Once the deviation is detected, the wake-up delay timer starts, and upon completion, the pump restarts.

2.8 PID sleep
With the Sleep by Flow setting (Image 2.9), the PLC monitors the flow meter reading to manage the pump’s sleep mode, functioning similarly to the Sleep by PID feature described earlier. The key difference is that instead of triggering sleep mode based on a drop in PID output, the PLC initiates sleep mode when the flow rate falls below the designated setpoint. For example, if the flow drops below 1 GPM, the Jockey pump will enter sleep mode after the configured delay timer (as set in the sleep settings) completes.
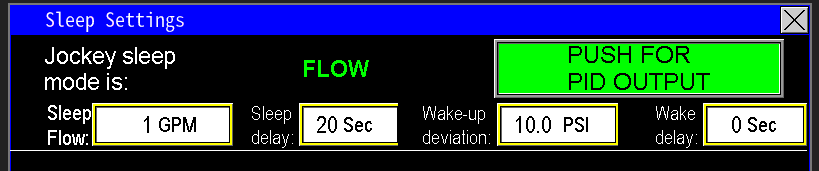
2.9 Sleep By Flow
Sleep by Level
The Sleep by Level feature is added to Omnia when the station is configured as a pump-down system, set during the initial factory setup in the Admin settings. In this configuration, the sleep settings screen will differ slightly, displaying a Push for Level option instead of Push for Flow, as shown in Image 3.0. This allows the PLC to monitor the liquid level to trigger sleep mode, rather than flow or PID output.
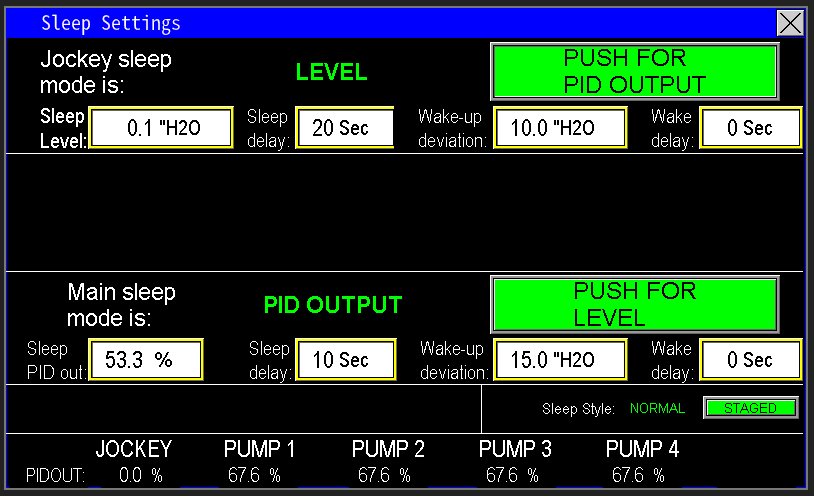
3.0 Sleep By Level
At the bottom of the screen (Image 3.1), the PID readout displays real-time data for all pumps. When calibrating the Sleep by PID setting, comparing the pump speed with the PLC’s output to the drive can help determine the optimal value for the Sleep by PID Output setting, as shown in Image 2.8. This ensures precise configuration for entering sleep mode efficiently.

3.1 PID output
Overcycle
The Overcycle Setting (Image 3.2) monitors the frequency of motor starts and stops. If the pump station experiences inconsistent variables or is not properly configured, pumps may repeatedly enter and exit sleep mode, leading to excessive cycling. This can cause significant wear and tear on the motor starting components and the motors themselves. Properly adjusting the overcycle settings helps mitigate this issue and prolongs equipment lifespan.
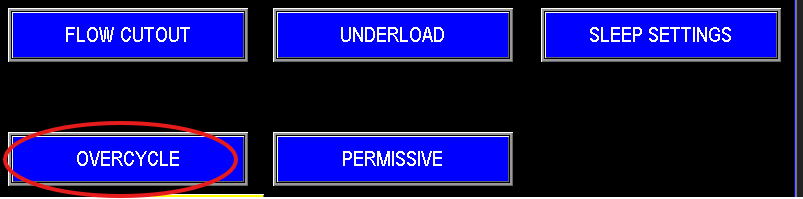
3.2 Overcycle
The Overcycle Settings Screen (Image 3.3) displays all pumps in the station and monitors their start/stop activity using two key parameters: Cycles and Delay. The Cycles parameter tracks the number of times a pump turns on and off, while the Delay parameter is a timer that resets the cycle counter every hour. For example, if the Jockey pump cycles 20 times within a 60-minute period, the system will send an email notification to the owner, indicating excessive on/off cycling. This alerts the owner that the station requires attention or that the automation settings controlling pump starts and stops need adjustment to reduce unnecessary wear and tear. Note that a cell modem must be installed and configured for email notifications to be sent.
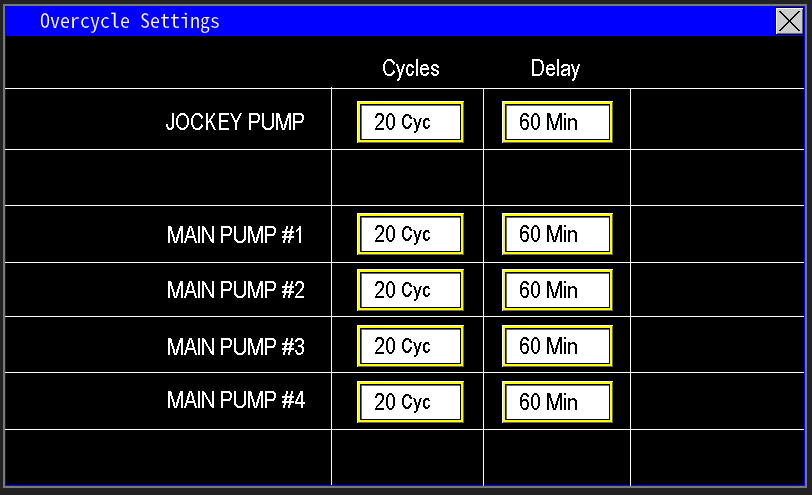
3.3 Overcycle settings
Permissive
Permissive is a feature added to Omnia to help monitor what state the station is in and what is currently happening to the starting sequence to the pumps (image 3.4).

3.4 Permissive Button
The Permissive Screen (Image 3.5), consistent across all pumps, displays the reasons behind a pump’s current operational state. For the Jockey pump, it monitors factors such as Power On Delay, HOA (Hand-Off-Auto) position in Auto, Remote Start, Sleep Settings, Fault Status, Flow Cutout Settings, and the Scheduler. A green status indicates that the specific condition is met, allowing the pump to start. A red status indicates that the condition is not met, preventing the pump from starting. In the example provided, the Jockey pump’s start sequence is halted because the operator is not in Auto mode, the pump is in Sleep mode, and there is an unresolved Fault.
The Enable/Disable function for the Jockey pump controls its start sequence. When Enabled, the pump follows the permissive indicators, and if all status lights on the Permissive Screen (Image 3.5) are green, the pump will start. When Disabled, the pump is completely prevented from starting in Auto mode, safeguarding the Jockey pump circuit during maintenance or when an issue is present.

3.5 Permissive enable disable
Harmonic filter
A Harmonic Filter (Image 3.4) stabilizes the incoming power supply to the control panel and variable frequency drive (VFD) while mitigating harmonics generated when a motor ramps up its speed via the VFD. In some cases, power companies mandate their installation to protect the power grid from harmonic fluctuations that could impact other customers. When installed, harmonic filters ensure stable power delivery to the VFDs. If the Jockey pump is equipped with a harmonic filter, a dedicated button will be available on the control panel to access its settings.

3.4 Harmonic Button
The Harmonic Filter control (Image 3.6) offers three virtual operator modes: OFF, TEST, and AUTO. In AUTO mode, when a motor starts and the harmonic filter is set to AUTO, a customizable timer delay activates. This delay allows the variable frequency drive (VFD) to ramp the pump to its normal operating speed, ensuring stable operation before the harmonic filter engages. The filter activates once the pump reaches a normal operating load, as harmonics can affect power quality at this stage, and remains active until the pump enters Sleep mode or is turned off.
In TEST mode, the harmonic filter activates immediately, bypassing the timer, and remains on until switched back to OFF or AUTO. The indicator next to the timer input value displays the harmonic filter’s status, showing either On or Off.

3.6 Harmonic Settiings
Pump Settings
Injector pump
Injection Pumps are integrated into stations designed to add chemicals or other substances to the water during pumping. These pumps work in coordination with injector valves to precisely control the amount of substance introduced into the water line. To access the Injector Pump Settings page, navigate through the main screen (Image 1.1).
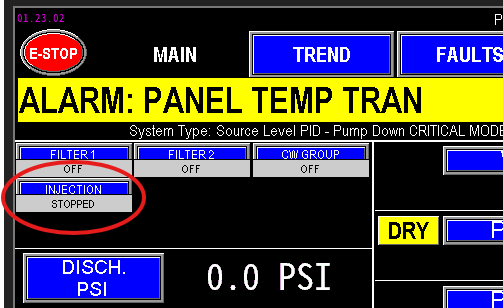
1.1 Injection Pump
When enter into the settings page for the injector pump (image 1.2) the configuration of the injector pump can be adjusted here.
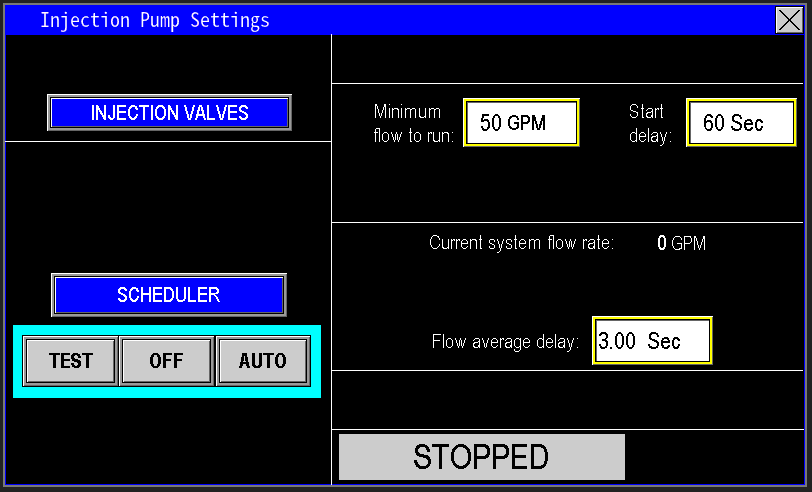
1.2 Injection Pump Settings
Injection Valves
The injection valves button (image 1.3) navigates to the injection valves settings (image 1.4). For information on how to control the Injection valves, navigate to the station valves section.
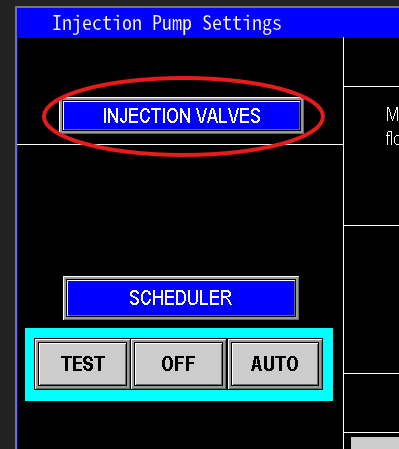 1.3 Injection valve button |
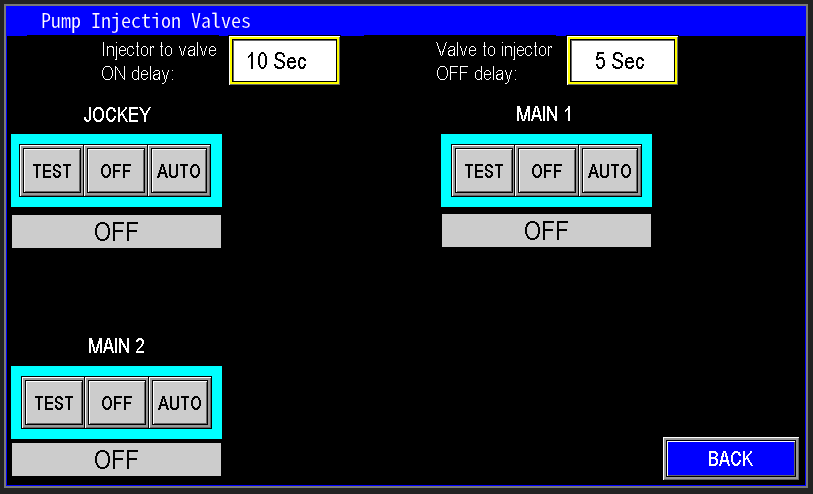 1.4 Injection valve settings |
Scrubber Valve
The scrubber valve button (image 1.31) navigates to the scrubber valve settings (image 1.41). Navigate to the station valves section for more information on the automation pertaining to the Scrubber Valve.
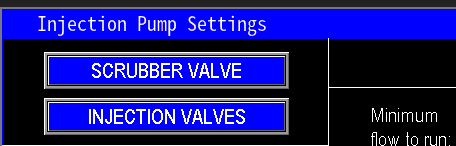 1.31 Scrubber Valve |
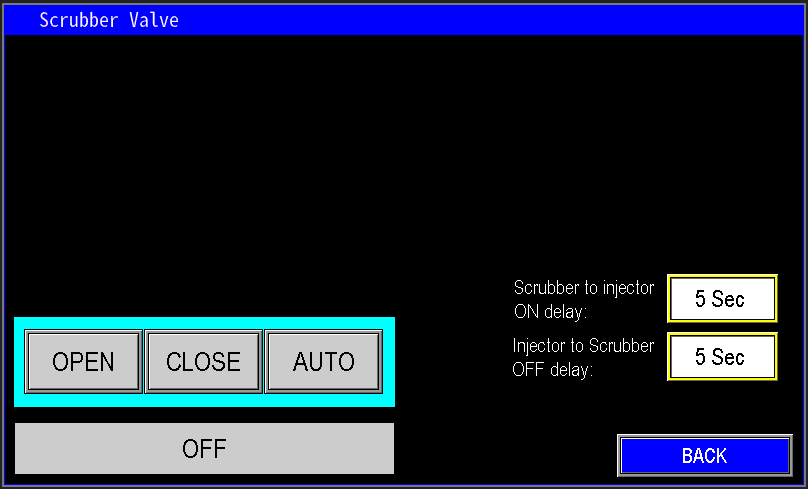 1.41 Scrubber Valve settings |
Scheduler
The Scheduler (Image 1.5) functions similarly to a sprinkler system scheduler but is designed for simpler setup and operation. It allows you to automate the run times for both the injection system and the pump station. Use this feature to program precise schedules for when the station and injection pumps should operate.
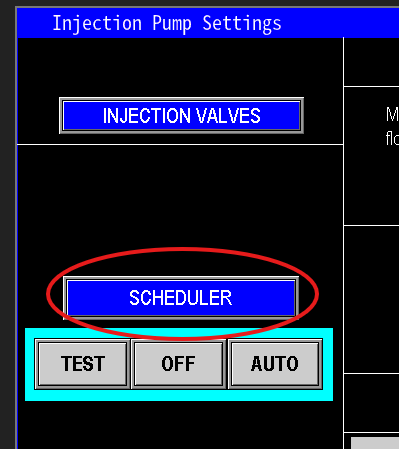
1.5 Scheduler
When configuring the Scheduler (Image 1.6), ensure that the injection pump is set to run alongside other pumps by verifying it is highlighted green, indicating it is selected for the scheduled time. This ensures synchronized operation with the station’s pumps.. For more information on how to set up the scheduler see the scheduler under the Main Menu Section.
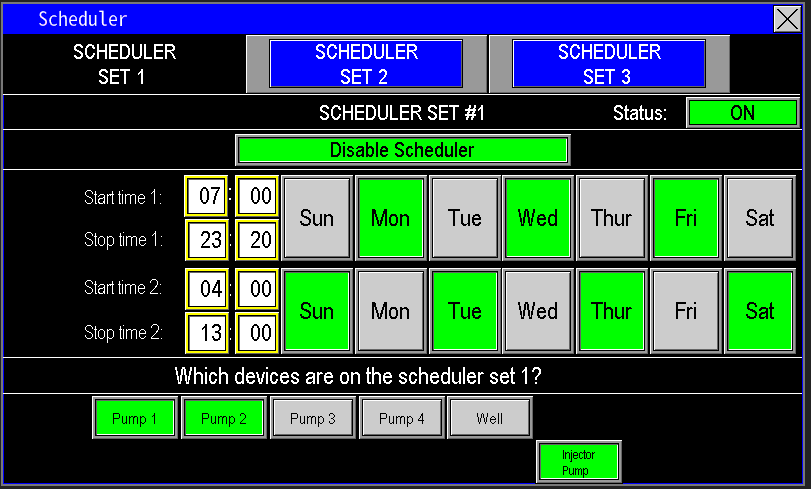
1.6 Scheduler selection
Virtual Operator
The Virtual Operator (Image 1.7) controls the injection pump and operates similarly to other pump operators in the system. It has three modes:
- TEST: Enables manual control of the injection pump, keeping it running until the operator manually turns it off or switches it to Auto.
- OFF: Completely stops the injection pump.
- AUTO: Allows the pump to operate automatically based on the PLC’s automation settings.

1.7 Virtual HOA
Minimum to run and delay
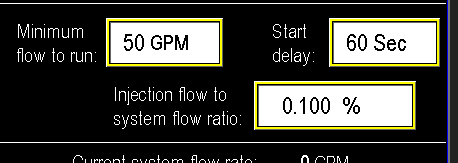
The Injector Pump is programmed to activate when the main pumps are running, with further automation provided by the Minimum Flow to Run and Start Delay settings (Image 1.8). These settings ensure the injection system only starts when a specified water flow rate is achieved. The PLC monitors the flow and waits until it reaches the set threshold. Once the flow meets or exceeds this value, a timer delay begins. If the flow remains above the threshold for the entire delay duration, the injection system activates. For example, if the flow reaches 50 GPM and maintains that level for 60 seconds, the injection system will start.
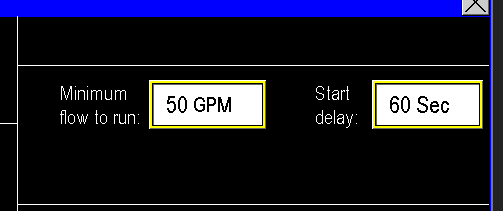
1.8 Min flow to run
Flow average delay
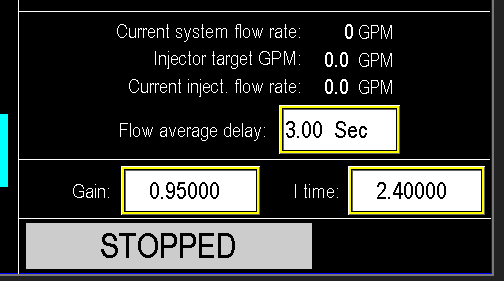
The Flow Average Delay automates the tracking of system flow by sampling it every 3 seconds, or whatever time is configured (Image 1.9). The injector system operates based on this 3-second flow average. If the flow drops below the required threshold during this period, the injection system will continue running until the 3-second delay timer elapses. Once the timer expires, the PLC detects the flow dropout and stops the injection system.
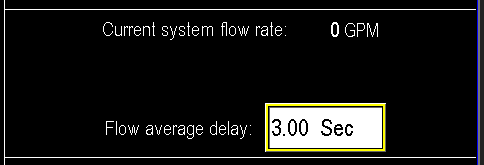
1.9 Flow average delay
Injection Flow Meter configuration
When an Injection Flow Meter is configured in the system, the automation becomes slightly more complex, and the interface updates to reflect this, as shown in Image 1.91. The injection flow meter provides additional data for precise control of the injection system, allowing the PLC to monitor and adjust based on the flow of the injected substance
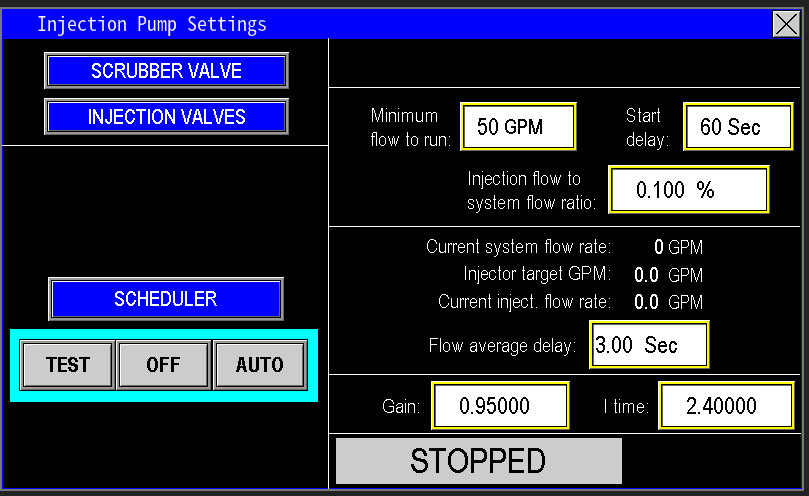
1.91 With flow meter config
With an Injection Flow Meter configured, the Minimum Flow to Run section includes an additional data register for the Injection Flow to System Flow Ratio (Image 1.92). In this setup, the PLC calibrates the injection flow as a percentage of the system flow. For example, if the system flow is 100 GPM and the ratio is set to 0.100%, the injection system will inject approximately 0.1 GPM of chemical, equivalent to about 1/10 of a gallon of injection solution per 100 gallons of water. Proper knowledge of the chemical and the injection rate being used is essential to providing safe concentrations of water to the destination.
1.92 Injection flow to system flow ratio
With the Injection Flow Meter configured, the system enables the injection pump to dynamically adjust its speed based on the required injection percentage relative to the station’s water flow. As shown in Image 1.93, the PID Controls populate to calibrate the injection pump’s variable frequency drive (VFD) speed, ensuring smooth responses to both the station’s water flow and the injection system’s flow. This PID operates based on Flow PID.
In the example provided (Image 1.93), the PLC calculates the Injector Target GPM using the current system flow rate and the Injection Flow to System Flow Ratio percentage. The screen also displays the Current Injection Flow Rate, showing the actual flow of the injection solution as measured by the injection flow meter, compared to the target flow set by the PLC. Using this data, the injection pump automatically speeds up or slows down to match the required injection flow. See the PID controls section for optimizing the injection pump’s performance for precise dosing.
1.93 Injection PID
Status
The indicator lamp at the bottom of the screen image 2.0) will show the state of the injector pump, whether it is off, running, faulted etc.
2.0 Status
Jockey Pump Settings
The jockey pump on Omnia systems is used as a pressure maintenance system and is usually used for getting the station to setpoint, and putting the station to sleep. Gain access to the Jockey pump settings by selecting Jockey on the main screen (image 1.0).

1.0 Jockey Button
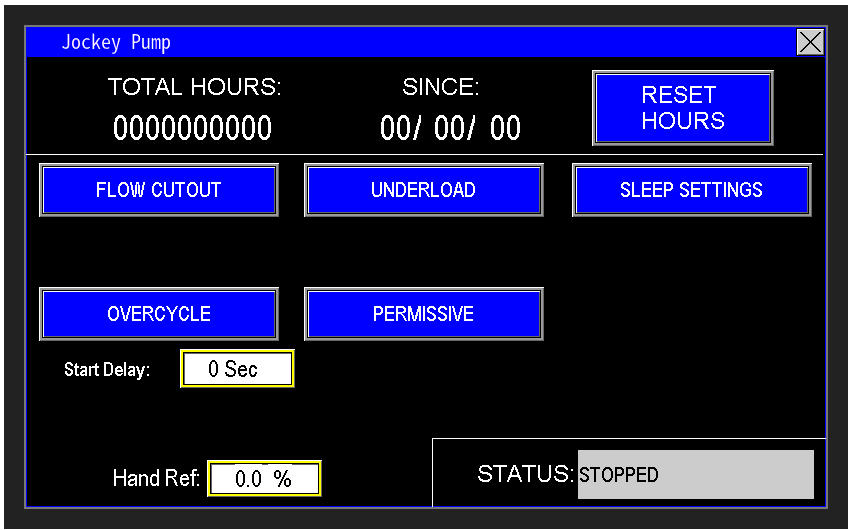
The main screen for the jock pump settings (Image 1.1) serves as the central hub for configuring settings to optimize the automation of the Jockey pump. While some settings are exclusive to the Jockey pump, most are applicable to other pumps in the system, making the automation process consistent across them. Certain settings specific to the Jockey pump’s automation, such as those in the Admin Setup section, are preconfigured at the factory based on the station’s design.
Jockey pump run totals
At the top of the screen (Image 1.2), the Motor Data for the Jockey Pump displays the accumulated run time while the motor is active. If the motor or pump is replaced due to a breakdown, the Reset Hours button allows you to reset the Total Hours to zero. Upon pressing this button, the Since date updates to the current date, providing an effective way to track the operational lifespan of each pump or motor.

1.2 Hours
Start Delay and Status
The Start Delay (Image 1.3) is a customizable timer that adds an extra delay before the Jockey pump starts. The Omnia program includes built-in timers to ensure the Jockey pump’s starting sequence is safe and does not interfere with other station components or automation. If your application requires additional time to enhance the pump station’s performance, this adjustable timer allows you to tailor the delay to meet specific needs.
The Status display indicates the current state of the Jockey pump, such as STOPPED, STARTING, RUNNING, FAULTED, or other relevant states.
 1.3 Time delay |
 1.4 Status |
Flow Cutout
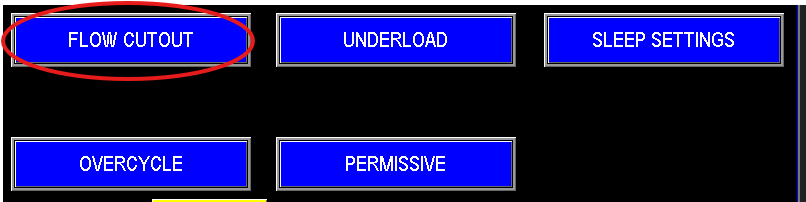
Flow cutout directs to the screen that allows the control of when the jockey should and should not run based on flow (image 1.5).
1.5 Flow Cutout
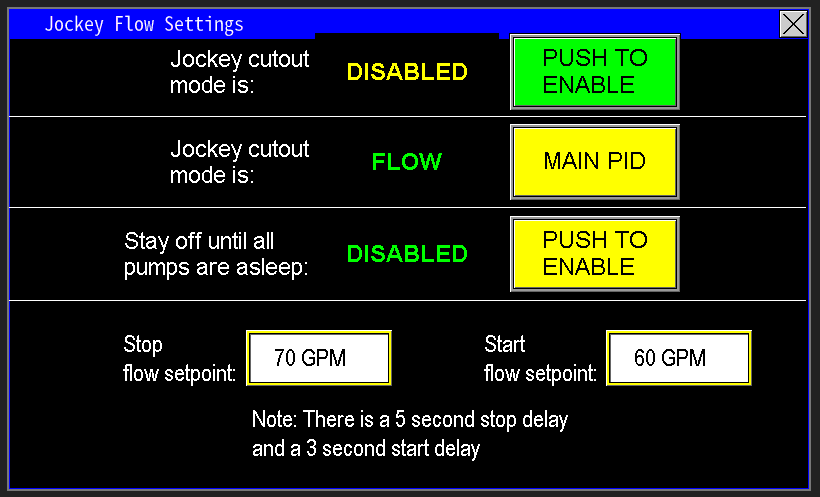
When the Flow Cutout button is pressed, the Jockey Flow Settings screen populates (Image 1.6), allowing customization of the Jockey pump’s automation based on station flow. From this screen, you can Enable or Disable the Cut In and Cut Out features. When enabled, the cutout mode can be set to trigger based on either Flow or PID Output, determining how the Jockey pump enters sleep mode.
The Stay Off Until All Pumps Are Asleep feature further tailors the panel’s operation to the station’s needs. When Disabled, the Jockey pump will restart if the flow drops below the Start Flow Setpoint and follow standard sleep settings and pressure maintenance. When Enabled, the Jockey pump shuts off once the station’s flow exceeds the Stop Flow Setpoint and remains off until all pumps in the station have entered sleep mode—essentially until the entire station is asleep. When water demand returns, the Jockey pump will then activate to assist in waking the station from its sleep state.
1.6 Jockey flow settings
Jockey Cutout Mode
When the Jockey Cutout Mode is Disabled, the Jockey pump operates normally alongside the main pumps, depending on the station’s configuration. Some stations require the Jockey pump to run concurrently with the main pumps, while others only need it to activate during the station’s startup or sleep phases. Typically, most stations can operate without the Jockey pump running continuously, as its primary role is to assist with starting the station and transitioning it to sleep mode.
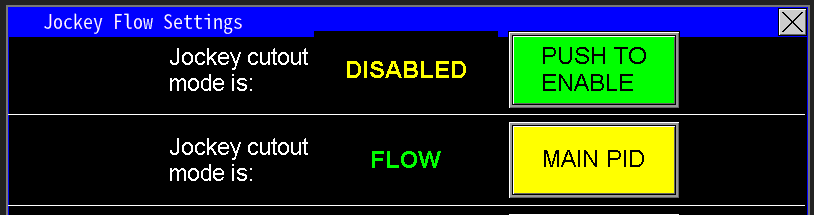
When the Jockey Cutout Mode is Enabled, you can configure the Jockey pump to start and stop based on either Flow or Main PID settings, as shown in Image 1.7. This allows for precise control tailored to the station’s operational needs.
 1.7 Flow cutout |
 1.8 PID cutout |
Jockey Cutout Mode is Flow
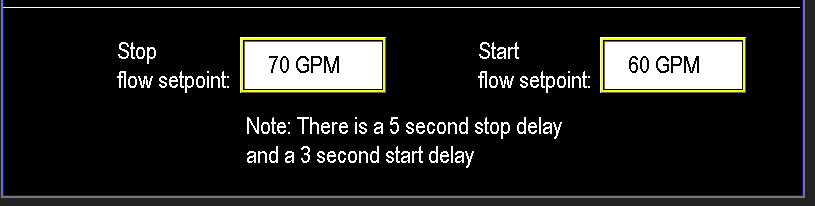
When the Jockey Cutout Mode is set to Flow (Image 1.7), the Flow Settings screen populates (Image 1.9), allowing you to configure the start and stop setpoints for the Jockey pump. In this configuration, the station waits until the flow reaches the Start Setpoint to activate the Jockey pump and the Stop Setpoint to deactivate it.
For example, if the flow meter reads 60 GPM or below, the Jockey pump will activate after a 3-second internal start delay. This is useful when the main pump is preparing to enter sleep mode or when the station is operating a smaller zone, allowing the Jockey pump to maintain lower pressure efficiently.
As the station wakes up or water demand increases, the Jockey pump is the first to activate or speed up. If pressure demands it, the main lead pump will engage a few seconds later, followed by the lag pumps. When the flow exceeds the Stop Setpoint for the Jockey pump, it will shut off after a 5-second internal stop delay, allowing the main pumps to take over and maintain the station’s pressure and flow. These setpoints are customizable to match the specific requirements of your pump station. Refer to the Omnia Manual for detailed instructions on configuring these flow settings for optimal performance.
1.9 Flow start stop
Jockey Cutout Mode is Main PID
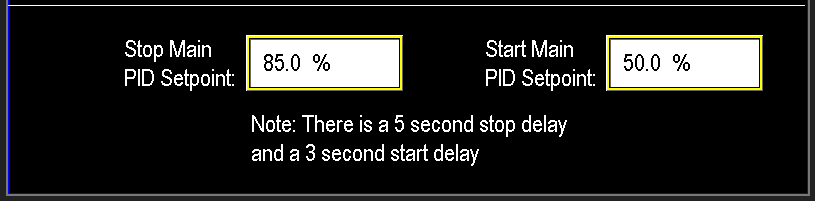
When the Jockey Cutout Mode is set to PID (Image 1.8), the PID Settings screen for the main pumps populates (Image 2.0), allowing the Jockey pump to start and stop based on the PID output demand of the main pumps.
In the example provided, if the main pump’s PID output is at or below 50%, the Jockey pump activates after a 3-second internal start delay. This setup is used when the main pump is preparing to enter sleep mode or when operating a smaller zone, enabling the Jockey pump to maintain lower pressure efficiently.
As the station wakes up or water demand increases, the Jockey pump is the first to activate or speed up. If pressure demands it, the main lead pump engages a few seconds later, followed by the lag pumps. When the main pump’s PID output exceeds the Stop Setpoint of 85%, the Jockey pump shuts off after a 5-second internal stop delay, allowing the main pumps to maintain the station’s pressure and flow. These setpoints are customizable to suit the specific requirements of your pump station.
2.0 PID start stop
All other settings for the intermediate pump are detailed in the Pump Settings section, which correspond to the settings of the other pumps.
Main pump settings
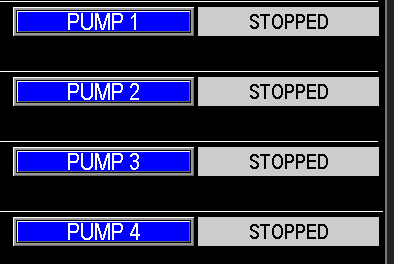
The Main Pumps are the core workhorses of the pump station, designed to meet the engineered specifications for pressure and flow. To access the Main Pump Settings, select any of the PUMP 1, 2, 3, or 4 buttons on the main screen (Image 1.1) or navigate through the MENU screens.
1.0 Main buttons
The Main Pump Settings screen (Image 1.1) is consistent in appearance for all main pumps, ensuring a uniform interface. However, each pump has its own dedicated page due to unique data such as the Hours, Totalizers, and Pump Status. While all main pumps operate similarly based on these settings, adjusting settings for one pump will apply to all Main Pumps on the station. Be mindful that changes made to one pump’s settings will impact the operation of all main pumps.
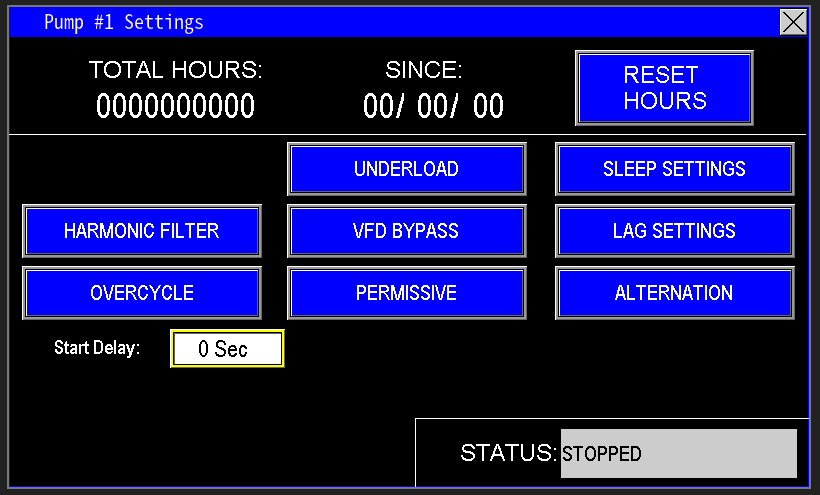
1.1 Pump Settings screen
Main Pump Run Totals
This section of the screen (Image 1.2) displays information specific to the selected main pump, such as Pump 1 in this example. It shows the Total Hours the pump or motor has run and the Since date, indicating when the hours were last reset. The Reset Hours button applies only to the specific pump selected, resetting its Total Hours to zero and updating the Since date to the current date. This feature is an effective way to track the operational lifespan of each pump or motor, particularly useful when a pump or motor is replaced due to a breakdown.

1.2 Total run hours
Start Delay and Status
The Start Delay for the main pumps (Image 1.3) is a customizable timer that adds an extra delay before the pump starts. The Omnia program includes built-in timers to ensure the main pump’s starting sequence is executed safely, preventing interference with other station components or automation. If additional time is needed to enhance the pump station’s performance for specific applications, this adjustable timer allows you to tailor the delay to meet those requirements.
The Status display indicates the current state of the main pump, such as STOPPED, STARTING, RUNNING, FAULTED, or other relevant states.
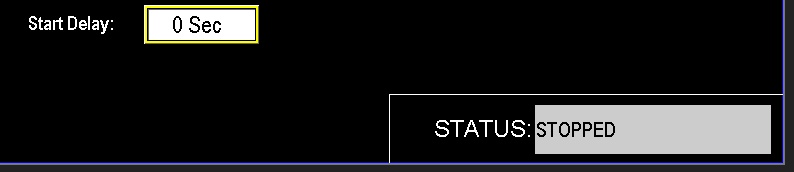
1.3 Start delay and status
VFD Bypass Settings
The VFD Bypass Mode (Image 3.0) disables the variable frequency drive (VFD), preventing it from slowing down the pump. When enabled, this mode impacts the automation of lag pumps, as the system relies on the lead pump’s hertz output to determine when lag pumps activate. Operating in bypass mode should not be done unattended, as it is intended strictly for emergency use. This mode is password-protected and should only be accessed by authorized personnel.
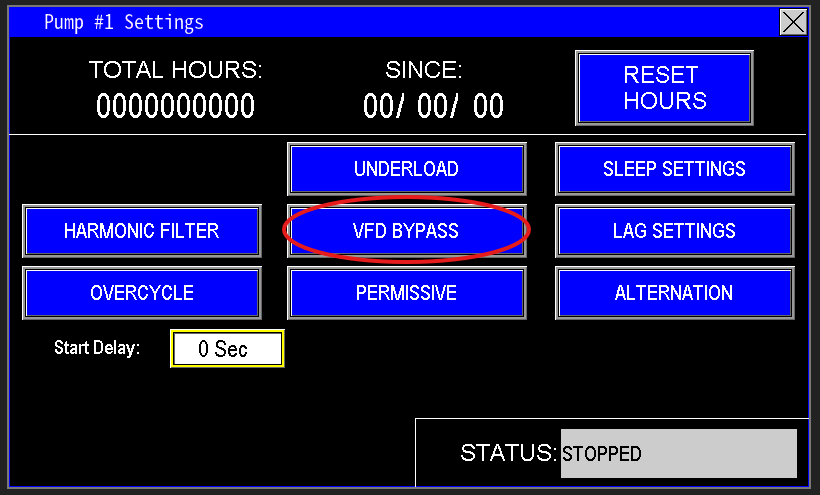
3.0 VFD bypass button
Lag Settings
Lag Pumps (Image 3.1) are the main pumps that activate after the lead main pump is running but unable to meet the station’s water demand. These settings must be carefully configured based on the main pumps’ performance and the station’s required flow. Improper configuration can cause high pressure spikes when a lag pump starts, potentially affecting system stability. Understanding and accurately setting these parameters is critical for smooth operation.
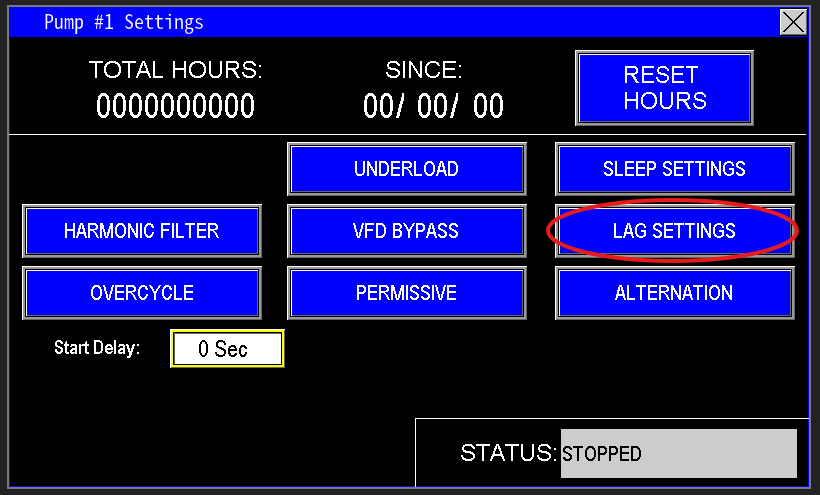
3.1 Lag settings button
Lag Settings (Image 3.2) are critical for ensuring the pump station operates effectively. Proper configuration of these settings is essential to avoid issues like pressure spikes or inefficient performance. Pay close attention to the guidance in the Omnia Manual and monitor how the station responds when the lag pumps activate to fine-tune these settings for optimal operation.
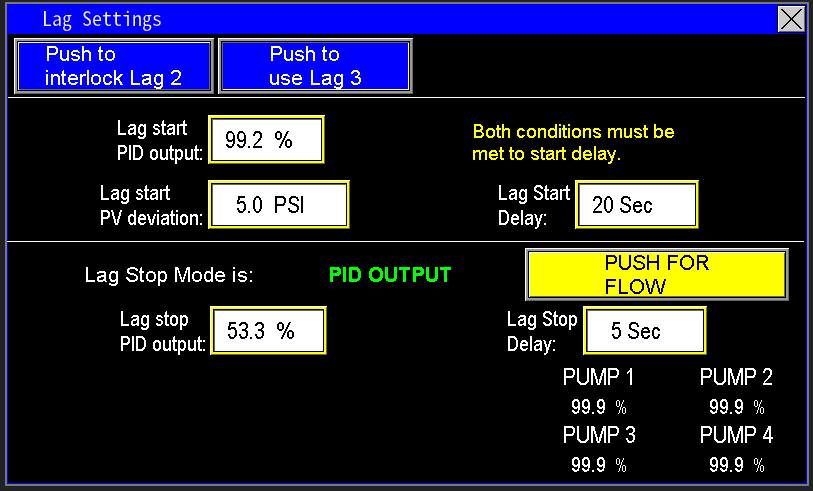
3.2 Lag setting screen
Lag Interlocks (Image 3.3) enable the locking out of a lag pump to prevent it from activating, which is useful when the system cannot handle the full load of all main and lag pumps running simultaneously. This feature provides the flexibility to manage the station’s capacity effectively.
Only one lag pump can be interlocked at a time. To ensure the station can utilize all available pumps, press the Push to Use Lag X button for the desired pump. To prevent a specific lag pump from turning on, press the Push to Interlock Lag X button.

3.3 Lag Interlock
Many pump stations are equipped with a Backup Generator (Images 3.4 & 3.5) to maintain operation during power outages. When utility power fails, the generator starts and powers the station. However, the generator’s output capacity can limit the station’s full capabilities. If the generator is undersized and cannot support the full load of all pumps, the system can be configured to manage which pumps operate.
The Push to Keep Lag on ATS Signal button (Image 3.4) indicates that the automation assumes the generator lacks the capacity to power all pumps simultaneously. In this case, the system prevents all lag pumps from activating while the generator is running, ensuring stable operation within the generator’s limits.

3.4 ATS generator signal
When the button displays “Push to Shed 1 Lag on ATS Signal” (Image 3.5), the automation assumes the backup generator has sufficient capacity to power the full capabilities of the pump station. In this configuration, the system allows all pumps, including lag pumps, to operate normally unless one lag pump is intentionally shed (disabled) to manage load or optimize performance while on generator power.

3.5 Push to shed
Lag Start
The Lag Start process for lag pumps depends on three key parameters: PID Output of the Lead Pump, Lag Start PV Deviation, and Lag Start Delay (Image 3.6). Both conditions—Lag Start PID Output and Lag Start PV Deviation—must be met to initiate the start delay.
In the example provided:
- The Lag Start PID Output requires the lead pump’s PID output to reach 99.2%, indicating the lead pump is operating at full speed.
- The Lag Start PV Deviation (Process Variable Deviation) is set to 5 PSI. This means the station’s current pressure must be at least 5 PSI below the setpoint. For instance, if the station’s setpoint is 65 PSI, the current pressure must be 60 PSI or lower.
If both conditions are satisfied for the entire duration of the 20-second Lag Start Delay, the first lag pump will activate. This process repeats sequentially for each lag pump in the station.
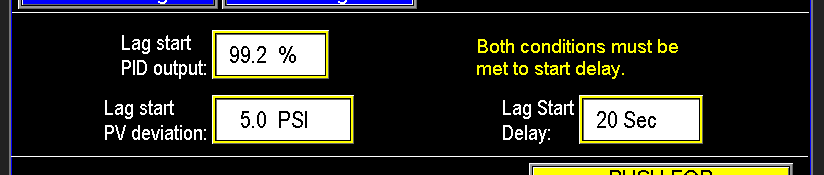
3.6 Lag start settings
Lag Stop
The Lag Pump Stop process is governed by two modes: PID Output and Flow (Images 3.7 & 3.8).
In the Lag Pump Stop PID Output mode (Image 3.7), the system monitors the PID output of the main (lead) pump and the Stop Delay timer. In the example provided, if the main pump’s PID output drops below 53.3%, the stop delay timer starts. If the PID output remains below 53.3% for the entire 5-second stop delay, the lag pump will turn off. To optimize this setting, carefully observe the main pump’s PID output before and after the lag pump starts and stops to determine the appropriate PID output threshold for deactivating the lag pumps.

3.7 Lag stop PID
The Lag Pump Stop by Flow mode (Image 3.7) requires two conditions to be met for a lag pump to stop. In this mode, the PLC monitors the station’s current flow. If multiple lag pumps are present, each will have its own Lag Stop Flow setpoint to determine when it should deactivate.
In the example provided:
- If the station’s flow falls below 800 GPM, the Stop Delay timer starts. If the flow remains below 800 GPM for the entire 5-second duration, the Lag 2 Pump will stop.
- As flow continues to decrease and reaches the 220 GPM setpoint for Lag 1 Stop, the same process applies, stopping the Lag 1 Pump after the 5-second delay.
Proper calibration of these flow setpoints is critical to ensure lag pumps stop only when they are no longer needed. Setting the Lag Start setpoint too low or the Lag Stop setpoint too high can cause excessive cycling of the lag pumps, leading to wear and inefficiency.
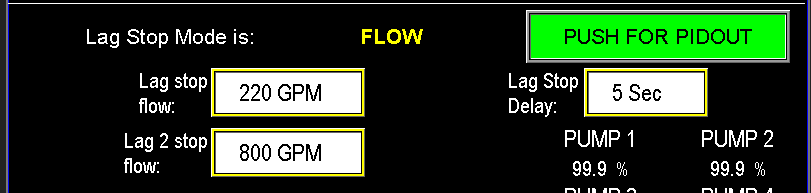
3.8 Lag stop Flow
Lag stop PID output reference
The Lag Settings Screen (Image 3.8) provides the PID Output Reference for each pump, allowing you to fine-tune settings without navigating away to monitor the station’s performance. This feature streamlines the calibration process by displaying real-time PID output data for each pump directly on the lag settings interface, ensuring accurate adjustments to optimize lag pump operation.
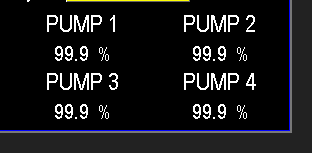
3.8 Lag PID reference
Alternation
The Alternation function (Image 3.9) enables the main pumps to rotate the role of the Lead Pump, which operates the longest during a watering cycle. Without alternation, the same pump would consistently serve as the Lead, accumulating more run time and experiencing greater wear and tear, leading to earlier replacement. By alternating the lead pump, this function distributes operational load evenly across the main pumps, extending their lifespan.
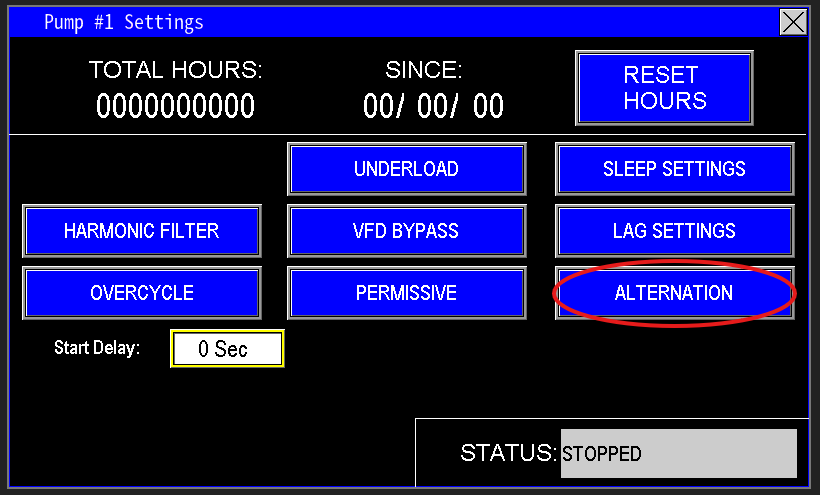
3.9 Alternation Button
The Alternation function (Image 4.0) is automated based on a customizable timer. When Enabled, the station alternates the lead pump role according to the time interval set in the value box. In the example provided, the pumps alternate as the lead every 10 hours. The Elapsed Time display shows how long the current pump has been serving as the lead while in its running state, not idle.
If Alternation is Disabled, the station will only change the lead pump in specific situations, such as when a fault occurs or if the operator for the lead pump is turned off. In these cases, the automation will automatically select another pump as the lead, and reset the timer.
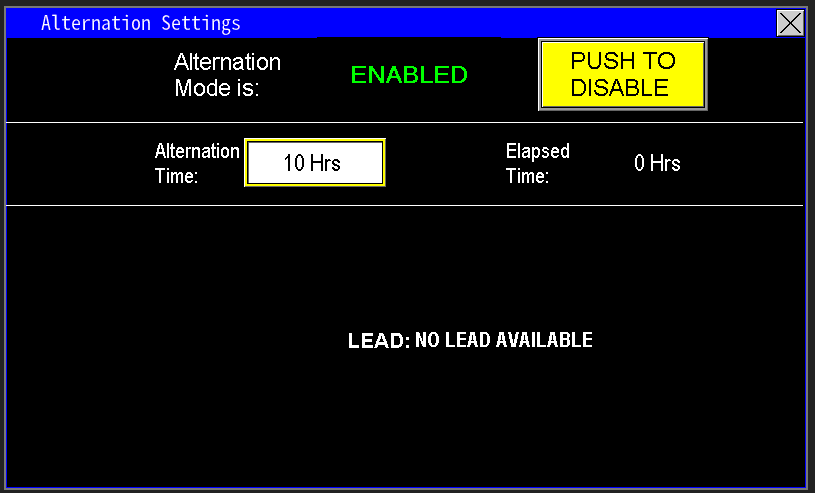
4.0 Alternation Settings
The Push to Alternate button (Image 4.1) serves as an input to the PLC, allowing you to manually force the station to alternate the lead pump. While the station is running, the screen displays which pump is currently designated as the lead. If all pump operators are set to the Off position, no lead pump will be assigned.
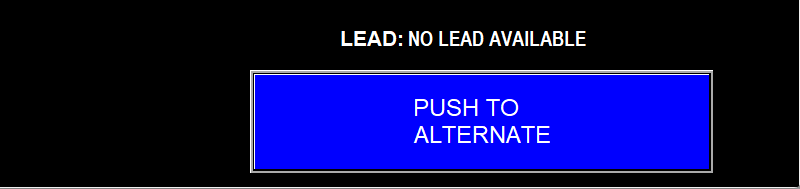
4.1 Push to Alternate
The ability to configure whether the station alternates lead pumps while running or only when not running is available in the Admin Settings, which are password-protected. For guidance on selecting the appropriate configuration or for any related questions, contact PPS services.
All other settings for the Main pump are detailed in the Pump Settings section, which correspond to the settings of the other pumps.
Intermediate (Mid) Pump
The Intermediate (Mid) pump is a pump utilized in systems were the step from the main pumps and a Jockey pump is to great. It fits that void in the middle to help run smaller zones that the jockey pump cannot run, but the Main pump is too big.
Intermediate Pump Settings
The Intermediate pump settings are accessed through the main screen (image 1.1). Image 1.2 contains all the settings pertaining to the Intermediate pump. This screen follows the same basic outline as the Jockey pump with very few differences.
 1.1 Mid Pump |
 1.2 Intermediate pump settings |
Intermediate Pump Data
This section of the screen (Image 1.3) displays information specific to the intermediate pump. It shows the Total Hours the pump or motor has run and the Since date, indicating when the hours were last reset. The Reset Hours button resets the Total Hours to zero and updating the Since date to the current date. This feature is an effective way to track the operational lifespan of each pump or motor, particularly useful when a pump or motor is replaced due to a breakdown.

1.3 Pump run data
Start Delay
The PLC uses built-in timers for starting the intermediate pump. The Start Delay (image 1.4) lets the user add extra time to the startup sequence before the PLC calls the intermediate pump. Use this when the pump is starting before the system is ready for flow—adding the delay synchronizes the pump start with system readiness.
The bottom-right shows the pump status (running, idle, faulted, etc.).

1.4 Start delay
Flow Cutout
Similar to the Jockey pump, the Intermediate pump also has the options to turn off and through flow to help stations wakeup, or go to sleep (image 1.5). When entered into the flow cut out screen, we can see the settings to control the intermediate pump settings. A flow meter is required for this to function correctly.
When disabled, the intermediate pump will follow normal pressure maintenance settings like the main pumps. When enabled, The pump will follow the Stop flow setpoints and start flow setpoints. In the screen example below, flow from the intermediate pump will start at any rate of flow less than 110 gpm, and stop once flow has reached 120 gpm or greater. The Stop time delay is set to 5 seconds internally, and the start delay is at 3 seconds internally.
The Stay Off Until All Pumps Are Asleep feature further tailors the panel’s operation to the station’s needs. When Disabled, the Intermediate pump will restart if the flow drops below the Start Flow Setpoint and follow standard sleep settings and pressure maintenance. When Enabled, the Intermediate pump shuts off once the station’s flow exceeds the Stop Flow Setpoint and remains off until all pumps in the station have entered sleep mode—essentially until the entire station is asleep. When water demand returns, the Intermediate pump will then activate to assist in waking the station from its sleep state.

1.5 Intermediate pump settings
All other settings for the intermediate pump are detailed in the Pump Settings section, which correspond to the settings of the other pumps.
Primer Pump
For stations that require suction at the intake (instead of self-priming pumps), a vacuum primer pump is used to lift water to the pumps. These stations include wet switches to confirm water has reached the pump volute before the main pumps start.
Primer Pump settings control the primer pump automation and ensure it works with the station. They can be accessed from the main screen (image 1.1) and from the menu screen as well (image 1.2), if the station uses one primer pump for multiple main pumps. If each main pump has its own intake (no shared intake line), a primer pump should be provided for each main pump; in that case, all primer pump controls are available only on the main screen (image 1.3).
 1.1 Main Primer |
 1.2 Menu Primer |
 1.3 Multiple primers |
Primer Pump Settings
The Primer Pump Settings (image 1.4) screen provides all controls to adjust the primer pump automation. If the station has multiple primer pumps, each will have its own screen, showing settings specific to that pump.
At the top, it displays data for the primer pump:
- Hours: Total run time since last reset
- Cycles: Number of times the pump has started and stopped
- Since: The date when the data started tracking or was last reset
Resetting hours clears the run time and cycle count to zero and updates the "Since" date to the reset date.
Below that is the Primer Fault Delay, which is the maximum time allowed for the primer pump to complete priming. If the pump exceeds this time, the station faults the primer pump, indicating an issue that must be fixed to ensure water reaches the pumps.
Next is the Virtual TOA (Test, Off, Auto):
- Test: Runs the primer pump continuously until manually stopped
- Off: Shuts down the entire primer system
- Auto: Returns the primer pump to PLC-controlled automatic operation
In the bottom right, the status indicates whether the primer pump is running, idle, faulted, etc.

1.4 Primer Pump Settings
Primer pump monitor screen
When multiple primer pumps are configured on a station, this screen (image 1.5) provides a snapshot of all their statuses. It appears after entering and then exiting the individual primer pump screens. The display shows each primer pump, their current status, and the fault delay setting for the station.

1.5 Primer Pump monitor screen
Recirculation Pump Operation
Recirculation Pumps are designed for low-pressure systems, primarily used in Omnia for water feature applications where the goal is to move a high volume of water with minimal head pressure. To achieve optimal efficiency, properly configuring the Low Pressure Delay and Recirc Pressure Settings is essential. These settings ensure the recirculation pump operates effectively for your specific application.
Recirculation Pump Settings
 1.1 Recirc Button |
 1.2 Recirc Pump settings |
Overview
If the station includes a Recirculation Pump, access its settings via the Main Screen (Image 1.1). The Recirc Pump Settings screen (Image 1.2) allows adjustments to optimize the pump’s operation. Before making changes, confirm whether the recirculation pump is equipped with a Variable Frequency Drive (VFD), as this impacts the available settings and configuration.
At the top of the screen (Image 1.3), the Motor Hours display shows the total runtime of the recirculation pump’s motor in hours. When commissioning the pump station on-site, press the Reset Hours button to set the motor timer to zero and update the Since date to the current date, starting the runtime tracking for the motor. If the motor is replaced, press the Reset Hours button after installing the new motor to reset the timer and update the Since date, restarting the hours cycle for the new motor.

1.3
Virtual TOA
In the bottom left corner of the Recirc Pump Settings screen (Image 1.2), the Virtual TOA (Test, Off, Auto) controls the operation of the recirculation pump (Image 1.4). The modes are as follows:
- TEST: Operates the pump in manual (hand) mode, allowing direct control.
- OFF: Turns the pump off completely.
- AUTO: Runs the pump according to the programmed automation settings.
When operating the pump in Test (manual) mode, ensure that personnel are present to monitor the station at all times. Failure to do so could result in severe damage to the pump, motor, or station, and will void all warranties.
The Status Bar below the TOA indicates the current state of the motor, which may include: STOPPED, STARTED, RUNNING, FAULTED, IDLE, RESTART DELAY, or SCHEDULER.

1.4 TOA
Remote mode and Scheduler
The operation of the water feature, including when it runs or stops, is fully customizable based on the end user’s preferences. Omnia provides two methods to control the water feature’s operation:
- Internal Scheduler (Image 1.9): Allows the end user to program specific run times directly within the Omnia system.
- External Scheduler via Remote Mode (Image 2.0): Enables control through an external scheduling system, allowing remote activation of the pump.
Whether or not a scheduler is present at the site, Omnia ensures the flexibility to run the recirculation pump whenever the end user requires.
Remote Mode
To access the Remote Mode Settings, navigate to the remote mode settings screen (Image 2.1). When Remote Mode is Enabled (Image 2.2), the recirculation pump waits for a start signal from an external controller (Image 2.3). Upon receiving the signal, the station activates the pump (Image 2.4). In this mode, the pump’s operation relies entirely on the external scheduler’s start command.
 1.9 Scheduler |
 2.0 Remote mode |
 2.1 Recirc remote mode |
| --- | --- | --- |
 2.2 Remote mode enables |
 2.3 Remote mode off |
 2.4 Remote mode on |
Scheduler
Omnia has a built in scheduler that allows for utilizing the stations calendar and clock to run the pump station when needed, or when remote signal is unavailable. See Scheduler Section to learn how the scheduler works, and how to customize it to work for the pump station's application.
Note: Remote mode and the scheduler can work simultaneously. If remote mode signal is high and the scheduler is not ready to start the pump station, it will wait till the scheduler is ready, then the pumps selected will start. Opposingly, if the scheduler is ready and remote mode is not receiving the signal yet, it will wait for the remote start signal before the station will start up.
Low Pressure delay
If the Recirc PSI Transmitter detects a low pressure condition, the PLC will initiate the Low Pressure Delay timer (Image 2.5). The recirculation pump will only fault for low pressure if the condition persists for the entire duration of this delay.

2.5
Restart Delay
When the recirculation pump is placed in Test Mode, a Restart Delay timer is activated before the program signals the station to start the pump (Images 2.6 & 2.7). Since recirculation pumps are designed for low Total Dynamic Head (TDH), restarting them while water is rushing back can cause undue stress and potential damage to the motor, pump, and motor starting components. The restart delay allows the water to settle, ensuring a smoother and safer startup.
The Bypass Button (Image 2.8) allows you to override the restart delay, enabling the recirculation pump to start immediately. Use this feature cautiously to avoid potential damage.
 2.6 |
 2.7 |
 2.8 |
Well Pump
Well Pumps integrated into pump stations are classified as part of the main pumps. They typically supply water to a tank or directly to the intake of the main pump station for watering cycles. The automation of well pumps varies based on the station’s configuration, with multiple setups possible. Below, we outline the different configurations and their respective automation settings.
Well Pump PID Configurations
When purchasing a pump station equipped with a well pump, it’s critical to understand the PID Process Variables that the well pump can be configured to follow within the Omnia program. The available process variables depend on the station’s design and are set during the initial configuration by PPS. If changes are made to the scope of the Well pump, this will need to be reconfigured by PPS.
Well Pump Settings
To access the well pump settings (image 1.1), enter through the main screen (image 1.2). From here all the settings to run the well pump are here. Each application will be different depending on the well configuration.
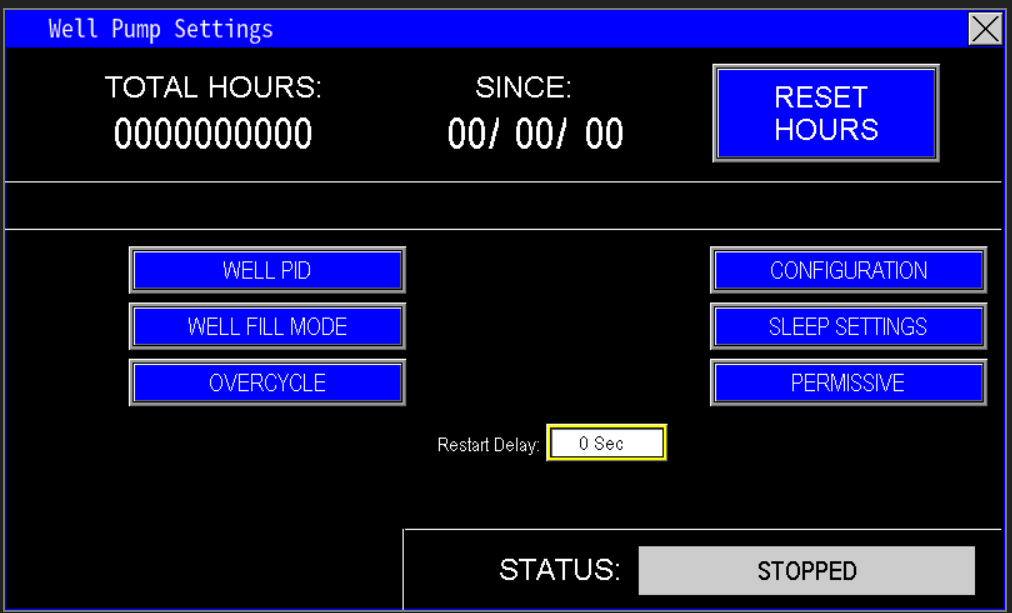 1.1 Well Settings |
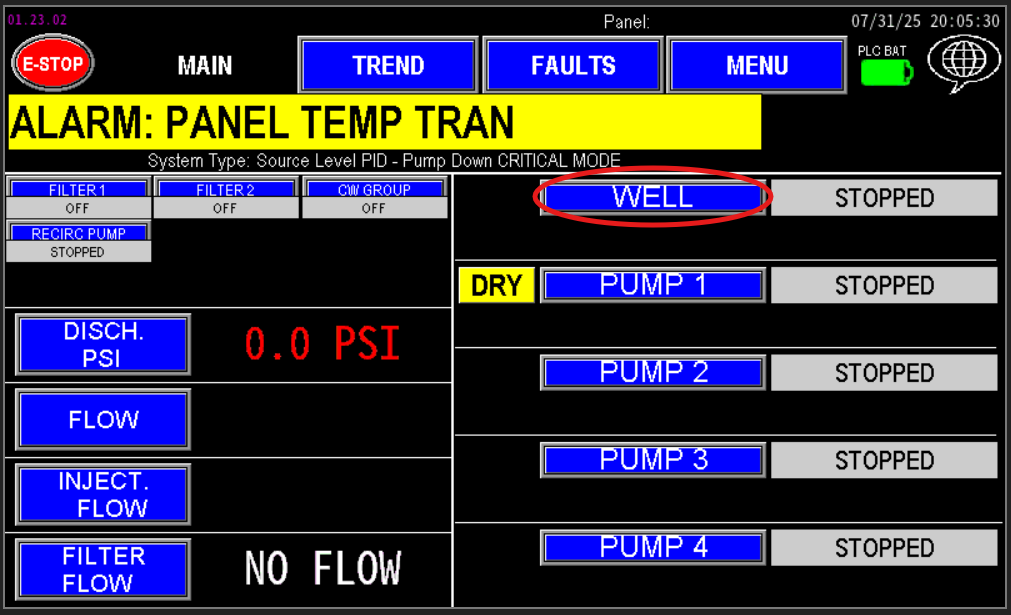 1.2 Well main |
Well Pump Data
The section of the screen (Image 1.3) displays the Total Hours the well pump or motor has been running, accumulating time during operation. If the pump or motor is replaced due to a breakdown, pressing the Reset Hours button will reset the Total Hours to zero and update the Since date to the current date.. This feature provides an effective way to track the operational lifespan of each pump or motor.
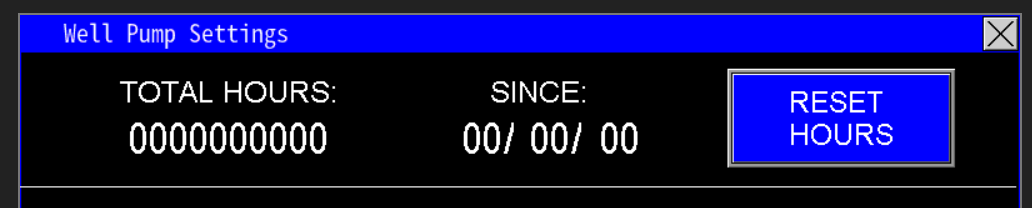
1.3 Well pump data
Well PID
The Well PID Button (Image 1.4) provides access to the Well Process Control Screen (Image 1.5), where the well pump’s operation is managed based on the configured Process Variable (e.g., pressure, flow, level, or PID output). The settings displayed on this screen depend on the station’s initial configuration, set at the factory. If you need to change the process variable, contact PPS for assistance with reconfiguration.
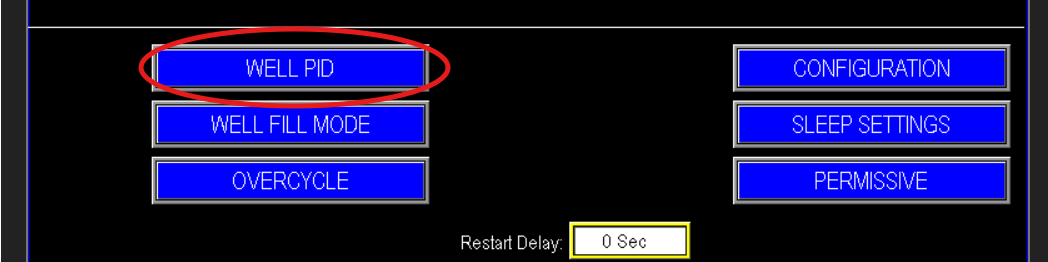 1.4 Well PID Button |
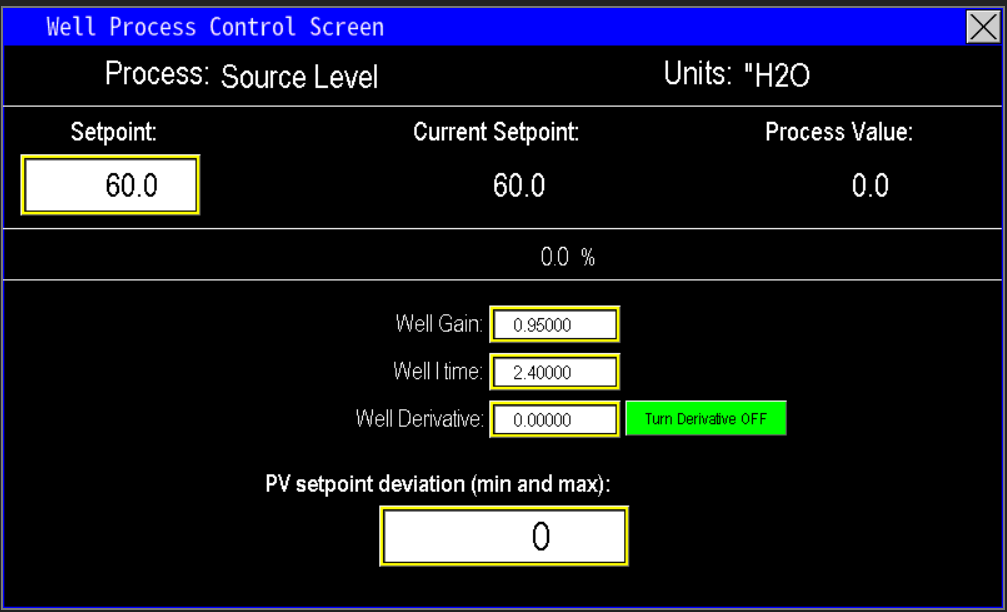 1.5 Well Process control screen |
Process variable and setpoint
At the top of the Well Process Control Screen (Image 1.6), the selected Process Variable for the Well pump is displayed. In this example, the Well pump is configured to follow the Source Level of the main pump station, meaning it operates to maintain the water level in the source tank.
- Units: The units of measurement for the setpoint are shown. In this case, the setpoint is 60 inches of water, indicating the target level the well pump is working to achieve.
- Current Setpoint: This reflects the setpoint the well pump is currently targeting, which may align with the configured 60" in this example.
- Process Value: This displays the current measured value of the process variable (e.g., the actual water level in inches), though the specific value is not provided in the example.
- PID Output %: This percentage indicates the output signal the PLC is sending to the variable frequency drive (VFD) to control the pump’s speed, ensuring it aligns with the setpoint.
The units and settings will vary based on the process variable selected during the station’s configuration (e.g., pressure in PSI, flow in GPM, or level in inches). If a different process variable is needed, contact PPS for assistance with reconfiguration.
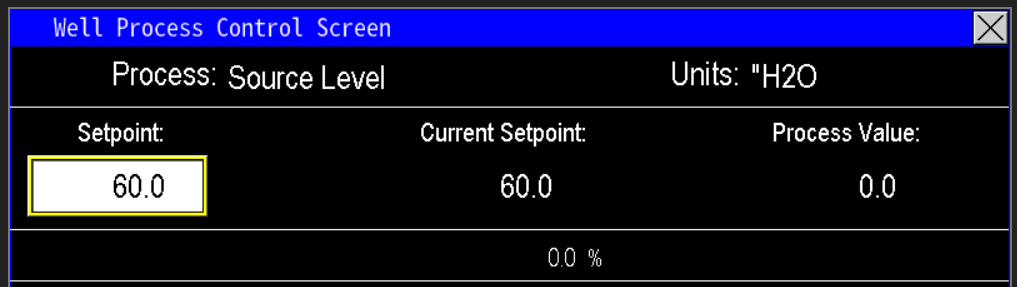
1.6 Well process control
PID Adjustments
The PID Adjustment Values on the Well Process Control Screen (Image 1.5) enable fine-tuning of the well pump’s response to the selected process variable (e.g., source level, pressure, or flow). This is achieved by adjusting the following parameters:
- Gain: Controls the proportional response, determining how aggressively the pump adjusts to deviations from the setpoint.
- I Time (Integral Time): Adjusts the time taken to correct steady-state errors, ensuring the pump reaches and maintains the setpoint.
- Derivative (if applicable): Smooths out rapid changes in the process variable, reducing overshooting or oscillations, though this is optional and used as needed.
These adjustments should only be made by personnel experienced with PID tuning to avoid instability or inefficient pump operation. Improper settings can lead to issues like excessive cycling or failure to maintain the setpoint.
Gain
The Gain setting (Image 1.7) adjusts the well pump’s output in proportion to the Offset, which is the difference between the current Process Variable (e.g., source level, pressure, or flow) and the desired Setpoint. Proper tuning of the Gain is critical for balancing responsiveness and stability:
- Low Gain: Reduces overshooting and undershooting, allowing the PLC to maintain the process variable closer to the setpoint with minimal oscillation. However, this results in a slower response time to reach the setpoint.
- High Gain: Speeds up the process variable’s approach to the setpoint, but increases oscillation. If set too high, the variable frequency drive (VFD) may cause the motor to rapidly speed up and slow down, leading to unstable operation and excessive oscillations.
- Balancing Gain: Setting the Gain too low can cause sluggish response, leading to dips or spikes in the process variable. Conversely, setting it too high can result in erratic motor behavior due to overly rapid reactions to changes in the process variable.
Adjusting the Gain should be done carefully by personnel experienced with PID tuning to ensure smooth and efficient pump operation.
Integration
The Integration (I Time) setting on the Well Process Control Screen (Image 1.5) determines how quickly the system applies corrections to eliminate the Offset—the difference between the current Process Variable (e.g., source level, pressure, or flow) and the Setpoint. When the Gain is properly set and the system is stable, there may still be a small offset from the setpoint. The I Time helps fine-tune the system to minimize this offset and bring the process variable closer to the setpoint (zero offset).
- High I Time (Faster Integration): Increasing the I Time causes the program to correct the offset more quickly, driving the process variable toward the setpoint faster. However, if set too high, this can lead to overshooting or undershooting, causing instability or oscillations in the system.
- Low I Time (Slower Integration): Decreasing the I Time slows the correction process, taking longer to reduce the offset and reach the setpoint. While this reduces the risk of overshooting, it may result in prolonged deviations from the setpoint.
- Balancing I Time: The I Time controls the speed at which the PLC applies corrections to the process variable. Proper adjustment ensures smooth convergence to the setpoint without excessive oscillations or delays.
Adjusting the I Time requires expertise in PID tuning to avoid destabilizing the system. It should be done by personnel familiar with these settings to achieve optimal performance.
Derivative
The Derivative setting on the Well Process Control Screen (Image 1.5) governs how the Omnia program responds to rapid changes in the Process Variable (e.g., source level, pressure, or flow). It is particularly useful for stabilizing the pump station during sudden, external events that cause significant fluctuations in the process variable.
- High Derivative: Increasing the Derivative value enhances the system’s response to dramatic changes, allowing the pump station to recover to the Setpoint more quickly. This can help stabilize the system during abrupt events but may lead to overcorrections if set too high.
- Low Derivative: Decreasing the Derivative value slows the system’s response to rapid changes, resulting in a more gradual recovery to the setpoint. This reduces the risk of overcorrections but may delay stabilization.
- Balancing Derivative: The Derivative setting is optional and typically used when fine-tuning is needed beyond Gain and I Time (Integration) adjustments. In most cases, proper configuration of Gain and I Time (as described in previous sections) can adequately stabilize the process, making Derivative adjustments less critical.
Adjusting the Derivative should be performed by personnel experienced with PID tuning to avoid instability, such as excessive oscillations or sluggish responses.
PV Setpoint Deviation (min and max)
The PV Setpoint Deviation setting on the Well Process Control Screen (Image 1.5) allows users to fine-tune the sensitivity of the well pump’s response to deviations from the Process Variable (PV) setpoint (e.g., source level, pressure, or flow). This setting adjusts the operational scope of the PLC, influencing how aggressively or conservatively the system reacts to changes in the process variable.
- Lower PV Setpoint Deviation: A smaller value makes the PLC focus more precisely on the setpoint, increasing the system’s reactivity. This causes the pump to respond quickly to even minor deviations, which is ideal for systems requiring tight control but may lead to overcorrections or oscillations if set too low.
- Higher PV Setpoint Deviation: A larger value widens the PLC’s acceptable range around the setpoint, making the system less reactive and slowing down response times to changes. This can stabilize the system by reducing rapid adjustments but may delay corrections if set too high.
- Customization for Station Variability: Given the diverse configurations and builds of pump stations, the ability to adjust the PV Setpoint Deviation ensures that the PLC’s response can be tailored to the specific needs of any station. This flexibility allows for precise calibration to optimize performance and stability.
Adjusting the PV Setpoint Deviation should be done by personnel familiar with the station’s operation and PID tuning to avoid issues like excessive cycling or sluggish performance.
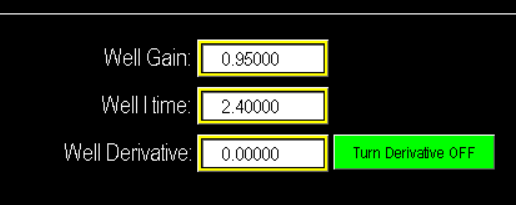
1.7 PID Values
Well Fill Mode
The Well Fill Mode (Image 1.8) is designed for Well pumps that supply water directly to the main line. In this mode, the PLC scales the ell pump’s speed based on the selected Process Variable (e.g., pressure, flow, or level) to maintain continuous water movement at a reduced rate, rather than shutting off the pump or faulting the station. This helps ensure smooth operation and prevents damaging components in the discharge line from sudden spikes in pressure.
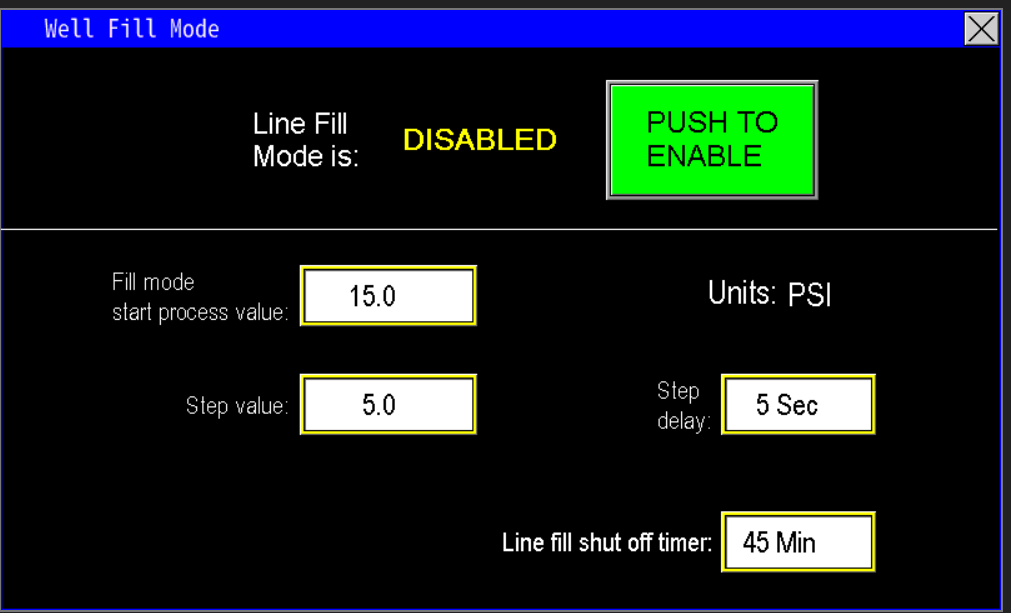
1.8 Well Fill mode
Fill Mode start process
When Well Fill Mode is Enabled (Image 1.8), the PLC will gather information from the Process Variable value, shown with its units on the screen (Image 1.9). If the process value from the transmitter is below the Fill Mode Start Process Value at start up (Image 2.0), the Well pump enters Fill Mode.
In the example given, if the pressure in the well’s discharge starts falls below the Start Setpoint of 15 PSI, the PLC activates Well Fill Mode. In this mode, the PLC adjusts the well pump’s setpoint to a temporary value based on the starting process variable (15 PSI in this case) and modulates the pump’s speed to maintain this new setpoint. The PLC will hold this temporary setpoint until the next operational step is triggered, ensuring continuous water flow at a reduced rate to prevent the pump from shutting off or faulting the station.
 1.9 Units |
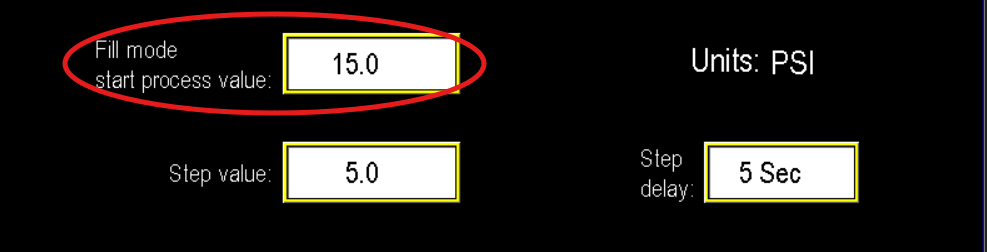 2.0 Process Value |
Step Value and Delay
The Step Value and Delay parameters determine how quickly the well pump increments the station’s pressure setpoint. In the example below (Image 2.1), the pump increases the setpoint by 5 psi per step. For instance, if the initial setpoint is 15 psi, the first step raises it to 20 psi. After the pump reaches and holds 20 psi for 5 seconds, it advances to the next step (25 psi). This pattern continues until the fill mode setpoint equals the well pump’s original setpoint. At that time, the pump exits fill mode and returns to normal operation.
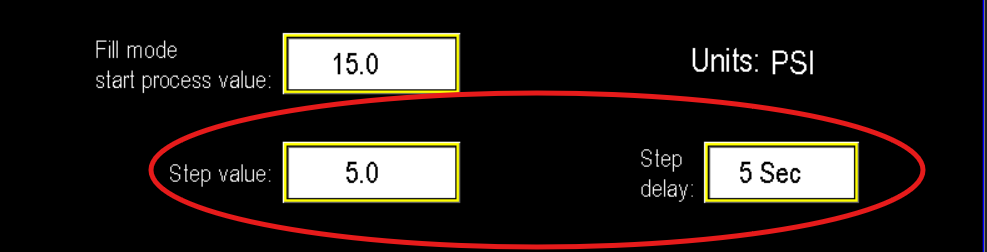
2.1 Step up and delay
Line fill shut off timer
This timer (image 2.2) sets the maximum duration for which Fill Mode remains active. Estimate the time required for the line to reach normal operating pressure and set the timer accordingly. If the line does not reach setpoint within this period, the station will fault, indicating the pump cannot achieve the required pressure.
In the example below, a 45-minute timeout will stop the pump if it fails to fill the line within that interval. Possible causes include pump malfunction, too many open zones, an open valve, or a ruptured pipe preventing pressure buildup.
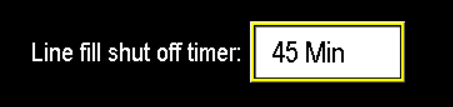
2.2 Line fill mode timer off delay.
Artesian Valve
When the well is configured with an Artesian Valve, a popup control button appears. This screen functions as a virtual HOA (Hand-Off-Auto) for the valve:
- OPEN — manually opens the valve
- CLOSE — manually closes the valve
- AUTO — allows the PLC’s automation to control the valve
Well Start Delay
The Well Start Delay sets how long the Artesian Valve remains open (per the value entered) before the well pump starts. This delay reduces well pressure to facilitate pump startup (image 2.3).

Configuration
The Well Configuration button opens additional well pump settings (Image 2.4). Available options depend on the factory configuration of the pump station; some features may be present while others are not.
If the station is configured with a virtual HOA, the HOA control will appear in the lower-left corner of the Well Settings screen (Image 2.5).
 2.4 Configuration |
 2.5 Virtual HOA |
Well Configuration Screen
The configuration screen displays additional automation options for the well pump (Image 2.6).
Remote Start
- If enabled, a remote start allows an external controller to command the well pump to start and stop.
Well Fill Mode (Tank/Pond Fill)
- Distinct from line fill mode, Well Fill Mode is used when the Well’s purpose is to fill a tank or pond.
- When enabled, a prompt appears to assign a recognizable name to the area being filled (for example, “POND”) (Image 2.7).
- The Well Settings screen will then show the assigned name and the cut-in/cut-out start/stop values (Image 2.8).
- Well Fill Mode requires a Well Source Level Transmitter. With a level transmitter, the pump will start at the entered cut-in level (e.g., 28 "H2O) and stop at the entered cut-out level (e.g., 30 "H2O).
Constant Speed
- The Constant Speed field lets you select a fixed operating speed for the well pump. When used, the pump will not follow PLC PID control.
- If a constant speed mode is required but the field is not present, contact PPS to enable this configuration.
Level to Fill
- Selects which level is used for fill control:
- Source Level: when the well supplies the tank/pond that serves as the pump station’s source.
- Destination Level: when the well is filling a tank for another system or area not tied to the control panel.
 2.6 Config screen |
 2.7 POND |
 2.8 Area name and cut-in cut-out |
Sleep Settings
Sleep Settings (image 2.9)
- Sleep behavior for the well pump matches other pumps: sleep by PID output or by flow (Image 3.0).
Displayed Information
- Setpoint: shows the well pump setpoint in the selected unit.
- Process Value: current feedback from the process variable (e.g., level or pressure transmitter).
- Example: the setpoint is 60 and configured as 60 gpm — this is factory-set and should be modified only by authorized personnel.
- PID Output: lower-right displays the PID output speed being sent from the PLC to the Well VFD.
 2.9 Sleep button |
 3.0 Sleep Settings |
Pressure Transmitters
Discharge Pressure Settings
Discharge pressure (image 1.1) is the primary control parameter for station operation. The automation system monitors the discharge pressure transmitter and adjusts pump operation to maintain the required pressure setpoint for the application.
Setpoints
- The setpoint is the target pressure the station must maintain.
- Some systems include two setpoints to allow the same pump arrangement to operate at different pressure zones or schedules (Image 1.2).
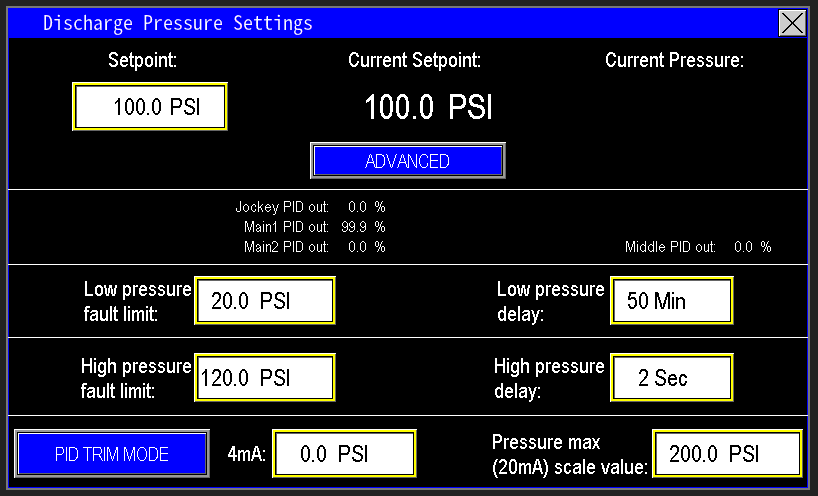 1.1 Discharge pressure settings |
 1.2 Setpoint 2 |
When Setpoint 2 is configured, an external input is typically wired to the station. When the PLC detects that input, it switches the station to Setpoint 2 and operates the pumps at that secondary pressure.
Current Setpoint and current pressure
The Current Setpoint reading shows the pressure the station is presently running at (image 1.3). Under normal operation this will match the station’s configured setpoint. However, when the station is operating in Level PID, Intake PID, or Fill Mode, the current setpoint may differ from the configured value.
Use this display as a diagnostic reference: if the station is not operating at its configured setpoint, the Current Setpoint indicates whether the PLC has reduced motor speeds due to one of the modes or control actions described above.
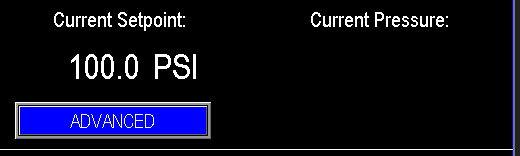
1.3 Current setpoint and pressure
Pump PID Output
Below the setpoint values is a readout of the PLC’s PID output to the drives (image 1.4), scaled as a percentage. This value represents the commanded drive speed (e.g., a PID output of 50% commands the drive to run at half speed). Use this readout to monitor station performance, refine precise PSI setpoints, and troubleshoot issues. In the example shown, the PLC is commanding the Main1 drive to run at 100% (full speed).

1.4 PID output reference
Low pressure fault limit and delay
The Low Pressure Fault Limit and Delay configure when the station will fault for low discharge pressure (image 1.5). Set the fault limit to the minimum acceptable discharge pressure and set the delay to accommodate the time the system typically needs to build pressure.
- Use site demand and historical fill times to choose appropriate values so the station is not faulted during normal startup.
- If the system cannot reach the configured pressure before the delay elapses, the station will fault, indicating a problem requiring inspection (e.g., pump issue, open zone/valve, or piping failure).
- When in Fill Mode, the station will not fault till it comes out of fill mode and hits setpoint. At which point, if the pressure falls back below the low pressure fault limit, then it will fault after the delay timer elapses.

1.5 Low pressure fault and delay
High pressure fault limit and delay
The High Pressure Fault Limit and Delay operate like their low-pressure counterparts but are configured to trigger much faster—typically within a few seconds—to protect system components (image 1.6). Set the high-pressure limit at or below the weakest component’s maximum allowable PSI to prevent damage. When the measured discharge pressure exceeds this limit, the station should fault and shut down immediately to protect the system.

1.6 High pressure fault and delay
Discharge PSI min (4mA) scale value and max (20mA) scale value (Transmitter scaling)
The PSI Min and Max scale values define the pressure range corresponding to the transmitter output on the discharge (image 1.7). Enter the pressure that corresponds to the transmitter’s 4 mA output as the Min (4 mA) scale value, and the pressure that corresponds to the 20 mA output as the Max (20 mA) scale value. These adjustable ranges allow replacement with transmitters of different span without requiring PLC reprogramming.

1.7 Transmitter scaling
PID trim mode
PID Trim Mode adjusts the station setpoint based on reduced source water levels (image 1.8), extending pump run time when levels fall. A level transmitter on the pump station is required for this feature.
When the station repeatedly faults on low-level conditions, PID Trim scales down pump speeds as the level declines, allowing the station to continue supplying flow rather than immediately tripping.
 1.8 PID trim mode button |
 1.9 PID trim mode screen |
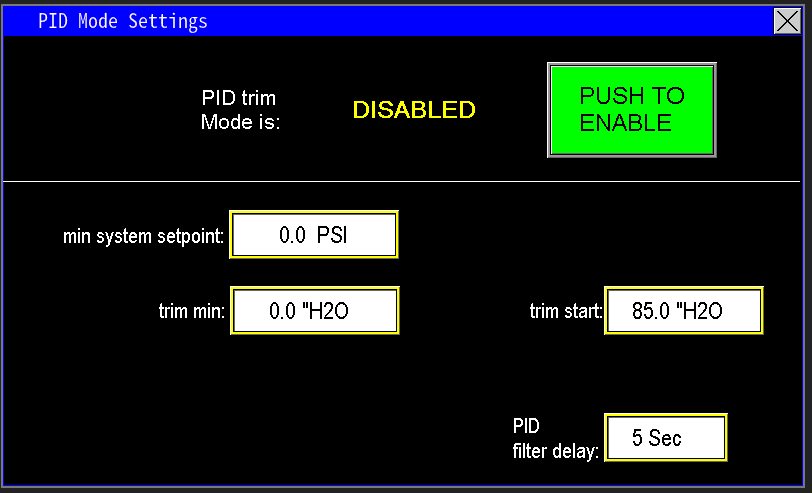
When PID Trim Mode is enabled, the station scales the discharge setpoint to reduce motor speed as source water levels decline.
- Minimum System Setpoint (Image 2.0): the lowest discharge pressure setpoint the station will operate at. Once the scaled setpoint reaches this minimum, the pump will run at that speed until a low-level fault occurs.
- Trim Start and Trim Min (Image 2.1): define the level-based scaling range.
- Trim Start: the source level at which the PLC begins reducing the discharge setpoint.
- Trim Min: the minimum source level at which the pumps should continue to operate.
Example: If Trim Start is set at 85" H2O and the configured setpoint is 100 psi, the PLC will begin decreasing the current setpoint at 85" and progressively scale the setpoint down until it reaches the Minimum System Setpoint.
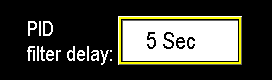
The PID Filter Delay (image 2.2) defines how often the station applies successive setpoint adjustments. When PID Trim conditions are active, the station updates the discharge setpoint at the configured interval (for example, every 5 seconds) until either a low-level fault occurs or source levels return to normal.
 2.0 min system setpoint |
 2.1 Trim min and start |
 2.2 PID filter delay |
Advanced Setpoint Settings
Selecting the Advanced button (Image 2.3) opens the Advanced Setpoint screen (Image 2.4). This screen provides additional control features in Omnia to optimize pump station performance. A flow meter is required for these advanced features to function.
This feature raises station discharge pressure based on measured flow to compensate for pressure loss in long or valve-heavy discharge lines. When enabled and configured, the Advanced Setpoint settings increase the discharge setpoint as flow increases, offsetting friction losses so adequate pressure is maintained at the line extremities.
 2.3 Advanced button |
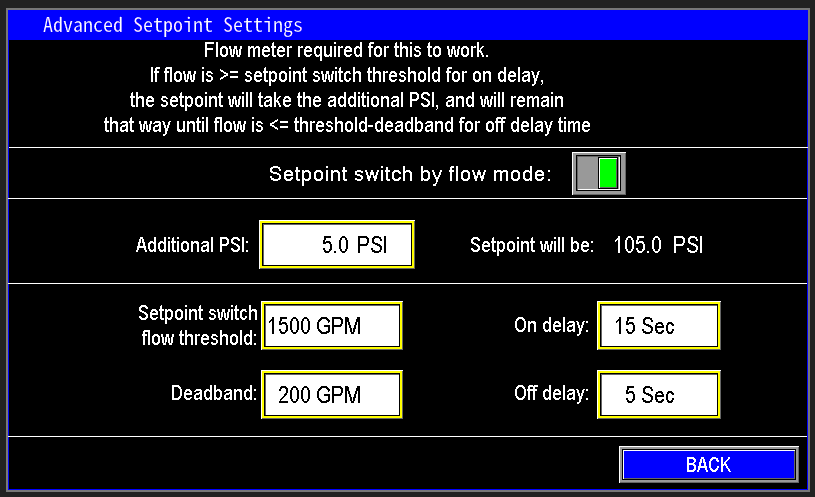 2.4 Advanced setpoint settings |
Additional PSI
To use this function, measure pressure at the end of the line. In the example (image 2.5), the station discharge is 100 psi while the affected zone reads 95 psi — a 5 psi loss. Enter the additional PSI value (5 psi) in the Advanced settings. The station setpoint will increase to 105 psi, delivering approximately 100 psi at the line end to compensate for the loss.

2.5 Additional setpoint
Setpoint switch threshold and Deadband
The Setpoint Switch Flow Threshold (image 2.6) defines when the flow-based pressure compensation activates. It requires a flow meter.
Example:
- Condition: flow ≥ 1500 GPM for longer than 15 seconds.
- Action: add the configured PSI offset (e.g., +5 PSI) to the discharge setpoint.
- Result: PLC increases pump speed until the discharge transmitter reads the new setpoint (e.g., 105 PSI), compensating for the downstream pressure loss.
 2.6 Setpoint switch flow threshold |
 2.7 Deadband |
The Deadband defines when the advanced flow-based pressure boost is turned off (image 2.7). It specifies the reduction in flow the meter must detect for the feature to deactivate.
Example:
- Setpoint Switch Threshold: 1500 GPM
- Deadband: 200 GPM below threshold → 1300 GPM
- Time qualifier: flow must remain below 1300 GPM for longer than 5 seconds
When this condition is met, the additional PSI boost is removed and the station returns to the normal discharge setpoint (e.g., 100 PSI).
Intake Pressure Settings
Intake pressure settings monitor the pressure feeding the station inlet. The intake source may be a gravity-fed tank or pond, or the discharge from another station (image 1.1).
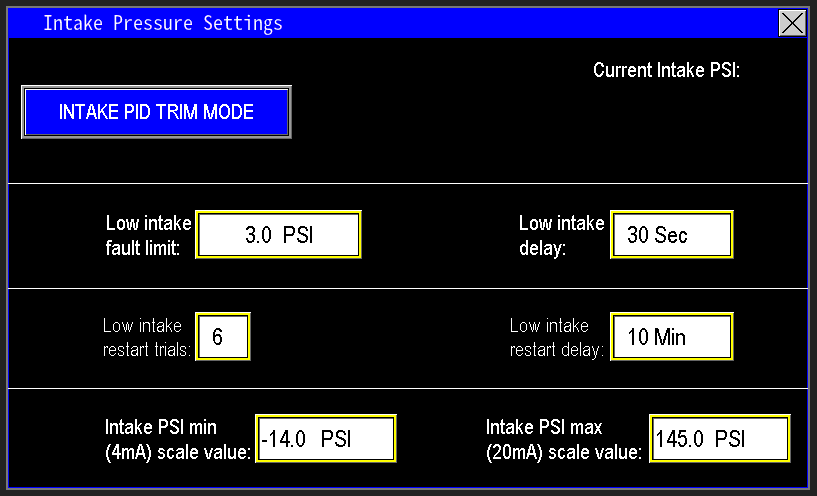
1.1 Intake pressure settings
Low intake fault limit and delay
This feature protects pumps by monitoring intake pressure to ensure adequate water supply (image 1.2). It uses two parameters:
- Low Intake Fault Limit: the minimum acceptable intake pressure.
- Low Intake Delay: the time the reading must remain below the limit before a fault is triggered.
If intake pressure falls below the fault limit, the delay timer starts. If the condition persists until the timer elapses, the station faults on low intake pressure to protect the pumps. If intake pressure recovers before the delay expires, the timer resets and normal operation continues.

1.2 Low intake fault limit and delay
Low intake restart trials and restart delay
This feature limits how many times the station may fault and automatically restart for low intake pressure (image 1.3).
- Low Intake Restart Trials: maximum number of automatic fault/restart attempts allowed.
- Low Intake Restart Delay: minimum time the station remains in a faulted state before an automatic restart is attempted.
Restart conditions:
- The intake pressure must recover above the low intake alarm limit for the restart delay to begin.
- If pressure remains below the alarm limit, the station stays faulted until manually reset.
If the station exhausts the allowed restart trials, any subsequent low-intake fault will remain latched and require personnel intervention to investigate and reset.

1.3 Low intake restarts and delay
Intake PSI min (4mA) scale value and max (20mA) scale value
The PSI Min and Max scale values define the pressure range corresponding to the intake transmitter output (image 1.4). Enter the pressure that corresponds to the transmitter’s 4 mA output as the Min (4 mA) scale value, and the pressure that corresponds to the 20 mA output as the Max (20 mA) scale value. These adjustable ranges allow replacement with a transmitter that has a different span without requiring PLC reprogramming.

1.4 Transmitter scaling
Current Intake PSI
This value displays the live pressure reported by the intake transmitter to the PLC (image 1.5).
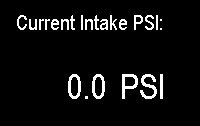
1.5 Current PSI
Intake PID trim mode
This selectable mode reduces pump speeds as intake pressure falls to extend run time when the station is nearing low-intake conditions (image 1.6). Enable PID Trim when a station is repeatedly faulting for low intake pressure so the pumps can continue supplying flow longer as intake pressure declines.
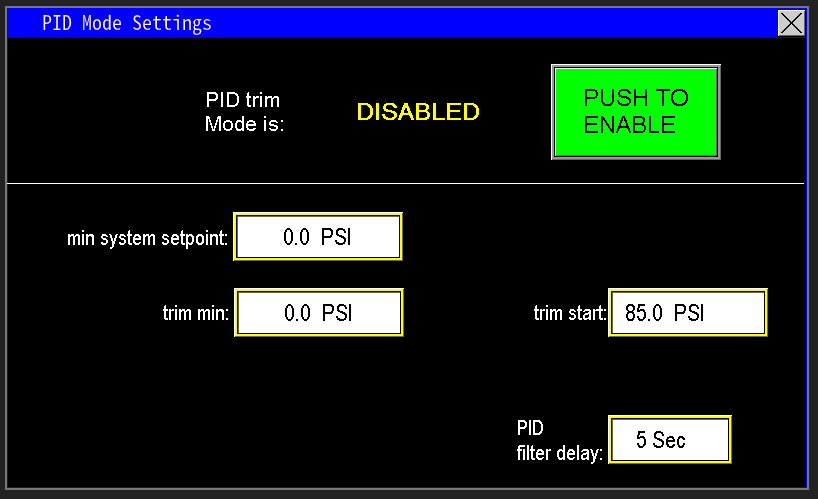
1.6 PID trim settings
Trim min and trim start
Trim Start and Trim Min define the level-based scaling the PLC uses to compute a reduced discharge setpoint (image 1.7):
- Trim Start: the intake pressure at which the PLC begins PID trim action because intake is declining to a concerning level.
- Trim Min: the lowest intake pressure at which the pumps may operate without running dry.
Between Trim Start and Trim Min the PLC progressively lowers the discharge setpoint to reduce pump speed and extend available run time.

1.7 trim min and start
When PID Trim is active, the PLC progressively lowers the discharge pressure setpoint to compensate for falling intake pressure. The setpoint continues to reduce as intake pressure declines until it reaches the configured Minimum System Setpoint (image 1.8).
Minimum System Setpoint
- The Minimum System Setpoint is the lowest discharge pressure at which the system can still operate effectively.
- Example: if normal discharge is 75 psi but acceptable operation continues at 55 psi, set the Min System Setpoint to 55 psi. PID Trim will not reduce the discharge setpoint below this value; if intake conditions worsen past this point, the station will fault on low intake.

1.8 Min system setpoint
PID Filter Delay
The PID Filter Delay defines the interval between successive PID adjustments (image 1.9). A longer delay slows the station’s response to changing intake pressure, while a shorter delay yields more frequent setpoint updates and faster reaction to level changes.
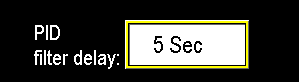
1.9 PID filter delay
Pre-WYE Pressure Settings (Intake Configuration)
WYE strainers affect station performance similarly to inline filters. Omnia supports two WYE strainer locations: intake side and discharge side. WYE strainers enable monitoring and automation to maintain normal operation while capturing debris.
Pre‑WYE Monitoring
- Purpose: monitor the pressure differential across the WYE strainer (pressure before vs. after) to determine strainer condition and when cleaning is required (Image 1.1).
- The Pre‑WYE settings screen mirrors the intake-side WYE configuration.
Configuration Note
- WYE strainer location is specified in the Administrator settings. If the configured location is incorrect, contact PPS Service for assistance with proper configuration.

1.1 Pre-WYE settings
Current Intake PSI
This value displays the live pressure reported by the intake transmitter (image 1.2). It represents the pressure on the discharge side of the WYE strainer (i.e., the intake side of the pump station).

1.2 Curent intake pressure
Differential PSI
The Current Pressure Differential displays the real‑time pressure loss across the WYE strainer. It is calculated by subtracting the intake PSI (downstream of the strainer) from the Pre‑WYE PSI (upstream of the strainer).
Example: Pre‑WYE = 25 psi, Intake = 15 psi → Differential = 10 psi across the WYE strainer.

1.3 Differential PSI
Pre-WYE PSI
The Pre‑WYE PSI reading is the live pressure measured on the intake pipe upstream of the WYE strainer (image 1.4). The control system compares this upstream value to the downstream intake transmitter to determine pressure loss across the strainer.

1.4 Pre-WYE PSI
Pre-WYE PSI min (4mA) scale value and max (20mA) scale value
The PSI Min and Max scale values define the pressure span for the Pre‑WYE transmitter (image 1.5). Enter the pressure corresponding to the transmitter’s 4 mA output as the Min (4 mA) value, and the pressure corresponding to the 20 mA output as the Max (20 mA) value. These adjustable ranges permit replacement with a transmitter of a different span without requiring PLC reprogramming.

1.5
Pre-WYE Pressure Settings (Discharge Configuration)
The Pre‑WYE configuration for a discharge‑side strainer mirrors the intake‑side setup (image 1.6). The only difference is the physical location: the WYE strainer is on the discharge side of the station.
- Differential calculation: Pre‑WYE (upstream of the strainer) minus the discharge pressure transmitter (downstream) yields the pressure loss across the strainer.
- Pre‑WYE transmitter location: upstream of the WYE strainer, on the discharge side of the pumps.
Pre-filter Pressure Settings
Stations with a water filter require additional monitoring to maintain reliable operation. A Pre‑Filter transmitter measures the pressure upstream of the filter to determine the pressure differential across the filter (upstream minus downstream). This differential indicates filter loading and serves the same purpose as a PSID switch but provides greater accuracy and configurability.
The Pre‑Filter settings screen (Image 1.1) enables monitoring of filter condition and configuration of automation actions (e.g., alerts, backwash, or maintenance reminders) based on the measured pressure differential.
A PSID switch mechanically detects pressure differential and sends a PLC signal when the filter is sufficiently dirty to require flushing. Mechanical switches, however, can fail—causing either no flushing or continuous flushing—necessitating switch replacement or an upgrade.
A pre‑filter transmitter provides a more reliable alternative. It continuously measures the upstream pressure and lets the PLC calculate the differential, enabling configurable, accurate filter monitoring. This approach reduces failure modes and gives operators flexibility to decide when to clean the filter rather than relying on a single mechanical switch.
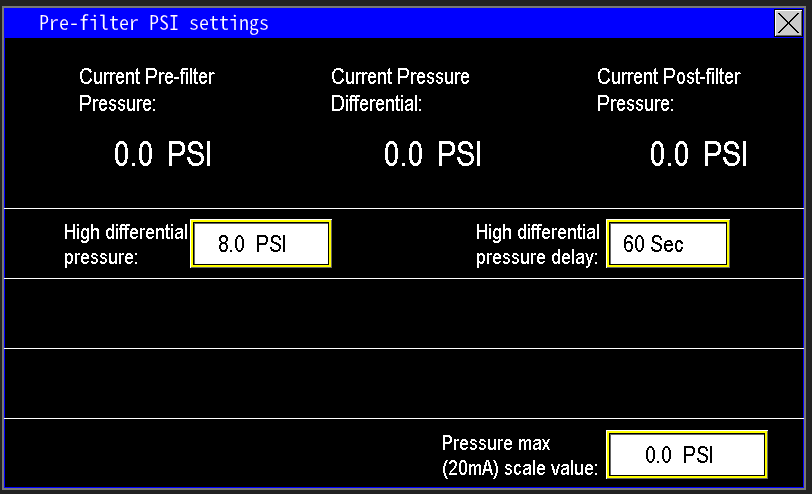
1.1 Prefilter PSI screen
Current Pre-filter Pressure
This value displays the live pressure measured by the pre‑filter transmitter (image 1.2). It represents the pressure downstream of the pumps and upstream (inlet side) of the filter.
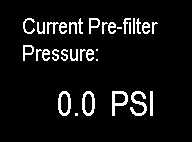
1.2 Current prefilter pressure
Current Pressure Differential
The Current Pressure Differential (image 1.3) shows the real‑time pressure loss across the filter. It is calculated by subtracting the discharge pressure (downstream of the filter) from the Pre‑Filter pressure (upstream).
Example: Pre‑Filter = 50 psi, Discharge = 45 psi → Differential = 5 psi.
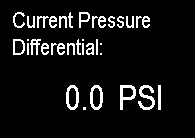
1.3 Current differential
Current Post-filter Pressure
This value displays the live pressure measured downstream of the filter (post‑filter)(image 1.4). It represents the pressure delivered to the application (e.g., irrigation system or potable supply). This reading is also shown on the main screen as Discharge Pressure (Image 1.5).
 1.4 Post-filter |
 1.5 Discharge pressure |
High Differential Pressure and delay
The High Differential Pressure setting (image 1.6) determines the pressure differential at which the automation initiates filter cleaning. This value is user‑configurable; the factory default is 8 psi. Select an appropriate differential based on system flow rate, incoming debris load, and filter screen size—higher flow or finer screens typically require a lower differential threshold for timely cleaning, while coarser screens or lower debris loads may allow a higher threshold.
The High Differential Pressure Delay sets how long the differential must remain above the high‑differential threshold before the filter‑cleaning sequence begins. Transmitter noise or transient flow changes can cause brief spikes in differential pressure; the delay prevents unnecessary flush cycles by requiring the condition to persist for the configured duration.
Example: if the high differential is 8 psi and the delay is 60 seconds, the differential must remain >8 psi for 60 seconds before the automation opens the flush valve to clean the filter.

1.6 High psi differential and delay
Transmitter Scaling
To ensure accurate readings, set the Pressure Max (20 mA) scale value to match the transmitter’s maximum range (image 1.7). At the transmitter, note its maximum pressure range and enter that value into the Pressure Max (20 mA) field so the PLC/SCADA displays correct values.

1.7 Transmitter scaling
Recirc Pump Pressure Settings
Recirc Pressure settings (image 1.1) govern the pressure used specifically for controlling the speed of the Recirc pump. These settings apply only to the recirc pressure transmitter and are independent of the other pressure transmitters that control the pump station.
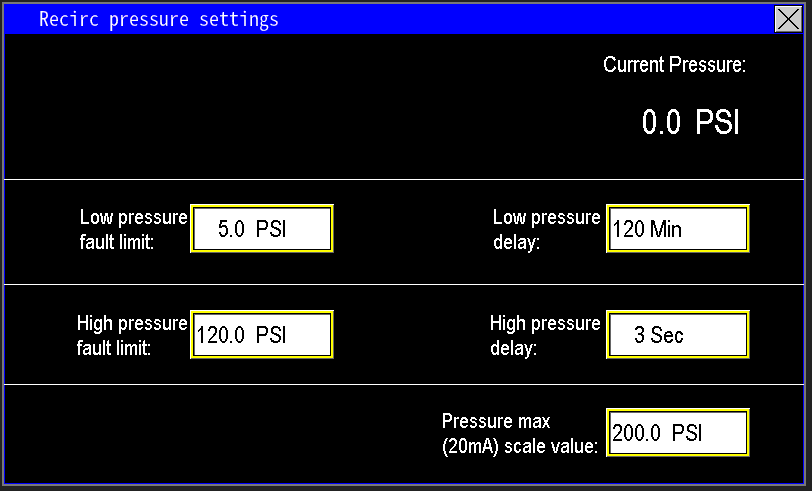
1.1 Recirc Pressure settings
Current Pressure
The Current Pressure value on this screen relates exclusively to the recirculation pump connected to the pump station panel — not the station discharge transmitters (image 1.2). Typically, the recirc pump operates at low pressure with higher flow (e.g., maintaining circulation or powering a water feature). The recirc pressure transmitter controls only the recirc pump speed and does not affect the operation of the station’s other pumps.
1.2 Recirc Current Pressure
Low Pressure fault limit and delay
Recirc pump protection uses two parameters: Low Pressure Fault Limit and Low Pressure Delay (image 1.3).
- Low Pressure Fault Limit: the minimum acceptable recirc pressure.
- Low Pressure Delay: the time the pressure must remain below the limit before a fault is declared.
If the recirc pressure falls below the fault limit, the delay timer starts. If the condition persists until the timer elapses, the recirc circuit faults to protect the pump. If pressure recovers before the delay completes, the timer resets and the pump continues normal operation.

1.3 Recirc low pressure fault limit and delay
High Pressure fault limit and delay
The Recirc high-pressure protection mirrors the low-pressure configuration but uses a much shorter fault delay—typically a few seconds—to protect system components (image 1.4). Set the high-pressure limit at or below the lowest maximum-rated PSI of system components to prevent damage. When the recirc pressure exceeds this limit, the recirc circuit will fault and shut down immediately. This fault applies only to the recirc pump; it does not fault the main station.

1.4 High pressure fault limit and delay
Transmitter scaling
To ensure accurate readings, set the Pressure Max (20 mA) field to match the transmitter’s maximum range (image 1.5). At the transmitter, note the device’s maximum pressure span and enter that value into the Pressure Max (20 mA) scale value on the screen. This ensures the PLC/SCADA displays correct recirc pressure readings.

1.5 Transmitter scaling
Well Pressure Settings
The Well Pressure settings govern the pressure used specifically for controlling the well pump. These settings are independent of the station’s other pressure transmitters and affect only well‑pump operation (image 1.1).
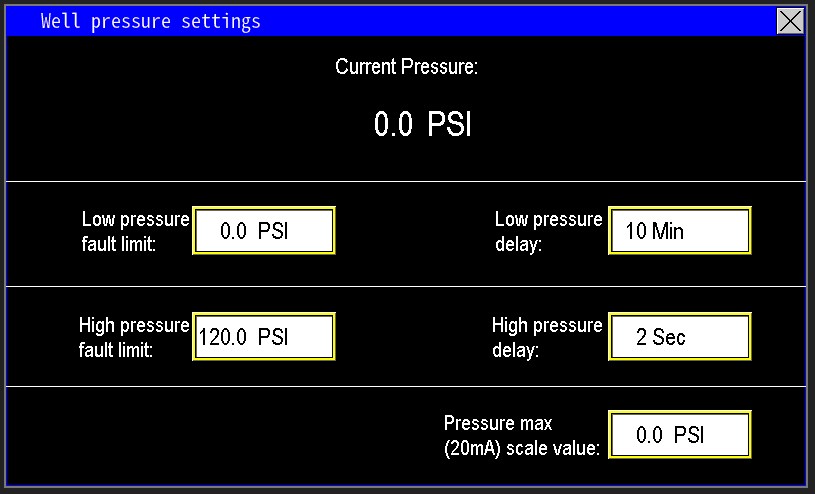
1.1 Well Pressure settings
Current Pressure
The current pressure reading (image 1.2) shown on this screen relates solely to the well pump connected to the pump station panel. It is not connected to or affected by the station’s discharge transmitters. In most applications, this well pump fills a tank or sump from which the station then pumps water out. The well-side pressure transmitter only controls the speed of the well pump and does not influence the operation of the station’s other pumps.
1.2 Current well pressure
Low pressure fault limit and delay
This feature uses two parameters: the Low Pressure Fault Limit and the Low Pressure Delay (image 1.3).
- If the pressure sensor reading falls below the fault limit, the delay timer starts.
- Once the timer elapses, the well pump circuit faults due to low pressure.
The delay allows the pressure system to recover before shutting down the pump. If the pressure stabilizes above the fault limit during the delay, the timer resets, and the well pump continues operation normally.

1.3 Low limit fault and delay
High pressure fault limit and delay
The high-pressure protection functions similarly to the low-pressure setup but features a much shorter fault delay—typically within a few seconds—to quickly protect system components (image 1.4). Set the high-pressure limit based on the maximum PSI rating of the weakest component to prevent damage. When the pressure exceeds this limit, the system faults and shuts down immediately. This protection applies only to the well pump circuit; other parts of the system are unaffected.

1.4 High pressure fault limit and delay
Transmitter scaling
To ensure accurate readings, match the transmitter’s maximum range to the Pressure Max (20 mA) scale value (image 1.5). At the transmitter, record the maximum pressure span and input that number into the Pressure Max (20 mA) field. This calibration step ensures the PLC or SCADA system displays correct well pressure readings.
1.5 transmitter scaling
Flow Meters
Fill Flow Meter Settings
Fill flow settings pertain to the system section controlled by the fill device (image 1.1). In many applications within Omnia and on pump stations, a flow meter may be used with the fill device to accurately monitor the volume of water diverted from the main flow. These settings enable tracking of the flow rate through the fill device, allowing precise measurement of water diverted, ensuring effective control and monitoring of the fill process.
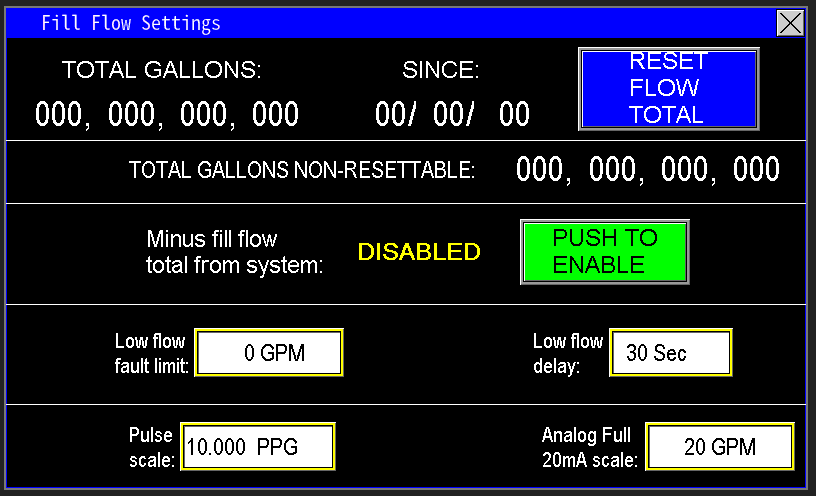
1.1 Fill Flow Settings
Total Gallons
The total gallons display shows the cumulative volume of water that has passed through the fill device flow meter since the date shown on the right side of the screen (image 1.2). This total is resettable; pressing the Reset Total button will reset the gallon count to zero and update the date to the current date displayed on the HMI.
This totalizer records the cumulative volume of water that has passed through the fill device since installation. It continually counts and cannot be reset, providing an ongoing record of total flow over the system’s lifetime.
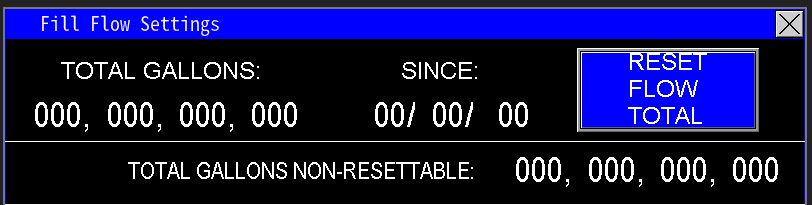
1.2 Totalizer
Minus fill flow total from system
The placement of the fill device relative to the station flow meter can impact the accuracy of flow measurements, leading to discrepancies in total station flow. To correct this, the flow measured by the fill device (fill flow meter) can be subtracted from the station's total flow (GPM). This adjustment ensures the calculated totals—daily, monthly, and yearly—accurately reflect the water delivered to the watering system, eliminating overestimates caused by the fill device’s position or other factors (image 1.3).

1.3 Minus Full flow total
Low Flow Fault Limit and Delay
This feature enables the user to set a flow threshold to monitor the efficiency of the fill line and ensure it is receiving sufficient water (image 1.4). When the flow drops below the set fault limit, the system activates an alarm to alert that the fill line may be underperforming. The delay period allows the system to continue operating at or below this limit for a specified duration, providing time for air pockets to clear or valves to fully open or close before the system faults. This prevents false alarms and ensures accurate monitoring of fill line performance.

1.4 Low flow fault and delay
Pulse Scale and Analog Full 20mA scale
Omnia supports monitoring station, fill, recirc, and well flow meters that output pulse or analog mA signals. For pulse meters, follow the manufacturer's instructions to determine the flow meter’s k‑factor (pulses per gallon). Enter this value into the Pulse Scale setting.
Next, zero the mA Scale—this activates the pulse measurement mode. If the mA scale is not zeroed, pulse readings will not function correctly. Once configured, the system converts incoming pulses into flow rates, displaying the flow in GPM on the main screen of the HMI (Image 1.6).
The Analog Full 20mA Scale should be set to match the maximum flow rating of the flow meter’s 20mA output. This value typically represents the highest flow the meter is rated to measure. For meters with adjustable 20mA span, verify that this scale matches the configured maximum output value on the flow meter to ensure accurate readings and proper system calibration.
 1.5 Flow meter scaling |
 1.6 Fill flow gpm |
Filter Flow Meter
The filter flow meter monitors the volume of water used to flush the filter. You can access and view this data (image 1.1), as well as configure related automation, either through the main screen (Image 1.2) or via the menu screen (Image 1.3).
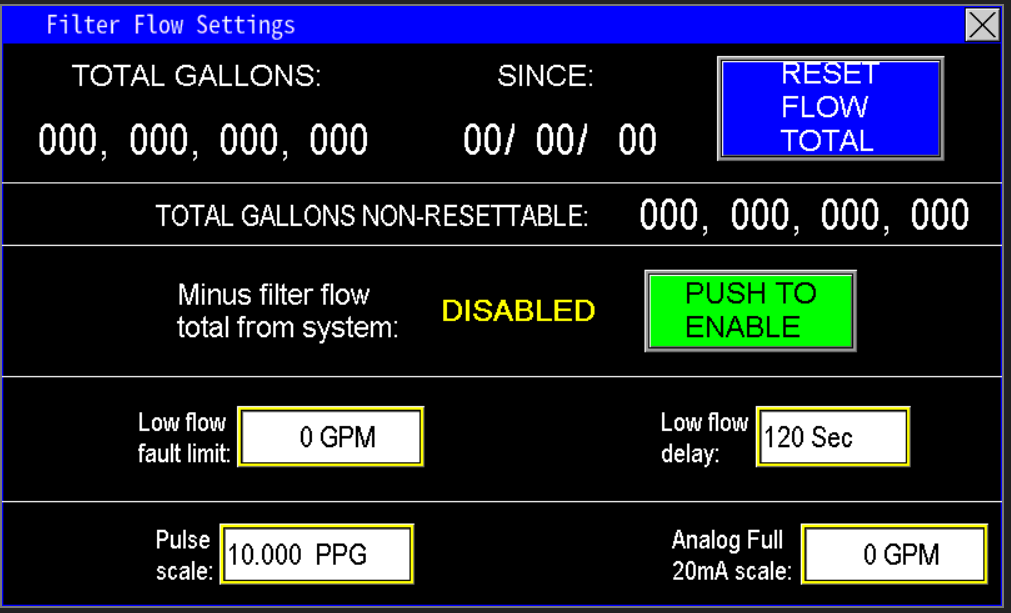 1.1 Filter flow settings |
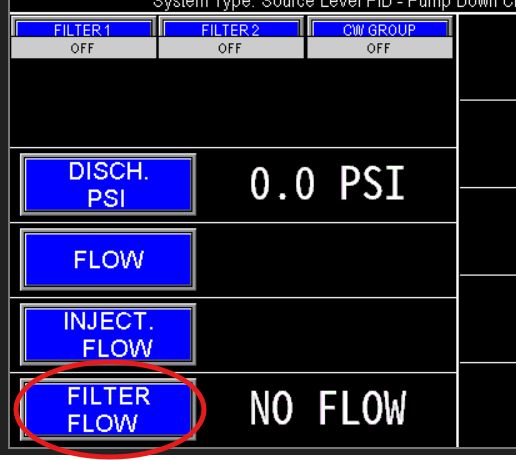 1.2 Filter flow main |
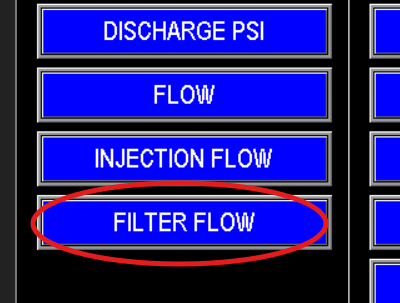 1.3 filter flow menu |
Filter Filter Flow Data
At the top of the screen (Image 1.4), the PLC displays real-time data collected from the filter flow meter, specifically the total gallons used for filter flushing. The "since" date indicates the last reset point; pressing the "Reset Flow Total" button will reset the gallons counter to zero and update the "since" date to the current date on the HMI.
Additionally, the Total Gallons Non-Resettable totalizer continuously records the overall volume of water used for filter cleaning since system installation or the last hardware reset. This total cannot be cleared or reset by the user.
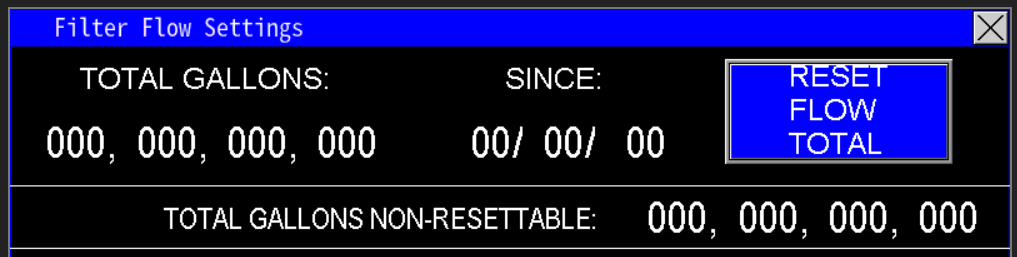
1.4 Filter Flow Data
Minus fill flow total from system
Typically, the filter flow meter is installed on the discharge side of the pumps before the station flow meter. However, in some applications, the filter may be positioned after the station flow meter. To ensure accurate measurement of the water delivered to the rest of the watering system, the volume recorded by the filter flow meter can be subtracted from the station flow meter's total flow (image 1.5). This adjustment corrects the totals for daily, monthly, and yearly reports, preventing overestimation caused by the filter’s placement.

1.5 Minus Filter Flow
Low Flow Fault Limit and Delay
The low fault limit is a user-defined threshold used to monitor whether the filter flush valve is receiving sufficient flow for effective cleaning (image 1.6). If the flow measured by the filter flow meter drops below this limit, the system initiates a delay timer. During this delay, the station continues to operate at or below the fault threshold, allowing time for air pockets to clear or valves to fully open and close. If the low flow condition persists beyond the delay period, the system will generate a fault, signaling that the filter isn't getting adequate water flow for proper cleaning.

1.6 Flow fault limit and delay
Pulse Scale and Analog Full 20mA scale
Omnia supports monitoring station, fill, recirc, and well flow meters that output pulse or analog mA signals. For pulse meters, follow the manufacturer's instructions to determine the flow meter’s k‑factor (pulses per gallon). Enter this value into the Pulse Scale setting.
Next, zero the mA Scale—this activates the pulse measurement mode. If the mA scale is not zeroed, pulse readings will not function correctly. Once configured, the system converts incoming pulses into flow rates, displaying the flow in GPM on the main screen of the HMI (Image 1.7).
The Analog Full 20mA Scale should be set to match the maximum flow rating of the flow meter’s 20mA output. This value typically represents the highest flow the meter is rated to measure. For meters with adjustable 20mA span, verify that this scale matches the configured maximum output value on the flow meter to ensure accurate readings and proper system calibration.

1.7 Flow meter scaling
Injector Flow Meter
The Injection Flow Settings pertain to the operation of the injector pump and its associated system (image 1.1). These settings typically control the amount of chemical or other substances being injected into the water system, ensuring accurate dosing and optimal system performance. Proper configuration of these parameters is essential for maintaining water quality and system efficiency.

1.1 Injector flow meter settings
Injector Flow Data
At the top of the screen (Image 1.2), the PLC displays real-time data collected from the injector flow meter.. The "since" date indicates the last reset point; pressing the "Reset Flow Total" button will reset the gallons counter to zero and update the "since" date to the current date on the HMI.
Additionally, the Total Gallons Non-Resettable totalizer continuously records the overall volume of water used for filter cleaning since system installation or the last hardware reset. This total cannot be cleared or reset by the user.

1.2 Flow data
Low flow fault limit and delay
The low fault limit is a user-configured threshold that monitors whether the injection system is receiving adequate flow (image 1.3). If the flow measured by the injection flow meter drops below this limit, a delay timer starts. During this delay, the system continues to operate at or below the fault threshold to allow time for air pockets to clear or valves to fully open and close. If the low flow condition persists beyond the delay period, the system faults the injection pump and the entire station, indicating that the injection system is not functioning correctly.

1.3 Low flow fault limit and delay
Omnia supports monitoring station, fill, recirc, and well flow meters that output pulse or analog mA signals. For pulse meters, follow the manufacturer's instructions to determine the flow meter’s k‑factor (pulses per gallon). Enter this value into the Pulse Scale setting.
Next, zero the mA Scale—this activates the pulse measurement mode. If the mA scale is not zeroed, pulse readings will not function correctly. Once configured, the system converts incoming pulses into flow rates, displaying the flow in GPM on the main screen of the HMI (Image 1.4).
The Analog Full 20mA Scale should be set to match the maximum flow rating of the flow meter’s 20mA output. This value typically represents the highest flow the meter is rated to measure. For meters with adjustable 20mA span, verify that this scale matches the configured maximum output value on the flow meter to ensure accurate readings and proper system calibration.

1.4 Transmitter Scaling
Leak Flow Meter
Leak flow meters are used on pump stations with primer or suction lift pumps. They monitor the total flow of water recirculating back into the intake side of the pumps, which helps keep the intake system primed. An abnormally high Leak flow indicates a leak at the foot valve or intake column. The system may cycle off and on to maintain discharge pressure, alerting operators to potential leak issues.
To configure leak flow monitoring, access the Leak Flow Settings via the Main screen (Image 1.1) or the menu screen (Image 1.2).
 1.1 Main Leak flow |
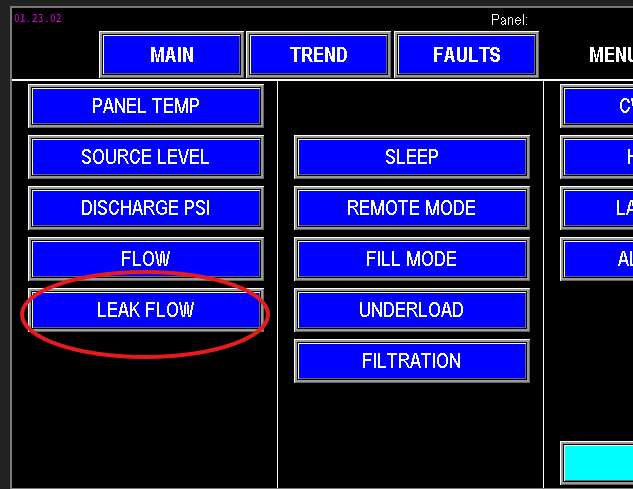 1.2 Leak flow menu |
Leak Flow settings
The values entered into the Leak Flow Settings screen (image 1.3) are the parameters the PLC will use to monitor and control the leak detection and prevention functions. These settings determine how the system detects excessive recirculating flow and triggers appropriate responses, such as cycling the pumps or generating alarms. Proper configuration ensures accurate leak detection and effective pump operation.
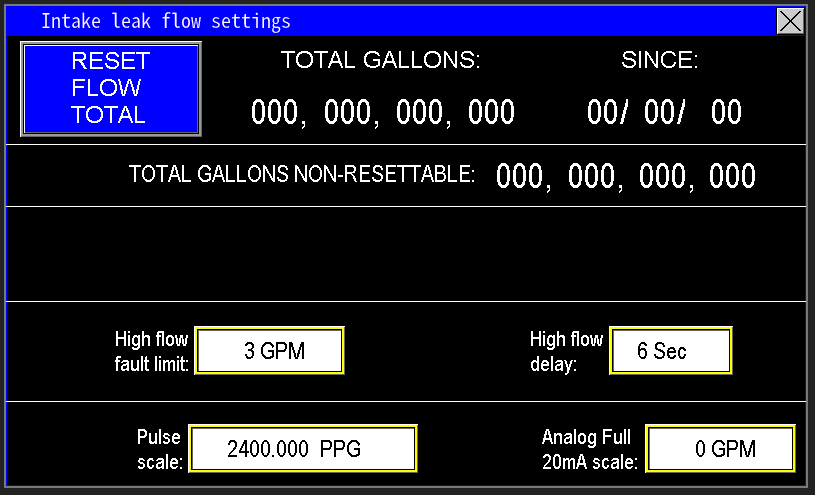
1.3 Leak Flow settings
Leak Flow Data
At the top of the screen (image 1.4) is all the data that the PLC is collecting from the Leak flow meter itself. This is the total gallons the Leak flow meter has registered getting put back into the intake side of the pumps. The “since” is the date that updates when the “Reset Flow Total” is pressed. When “Reset Flow Total” is pressed, the “since” will update to the current date the HMI is set at, and will zero out the Total Gallons totalizer.
The Total Gallons Non-Resettable totalizer cannot be reset, but shows how many total gallons the station has pumped in its lifetime.
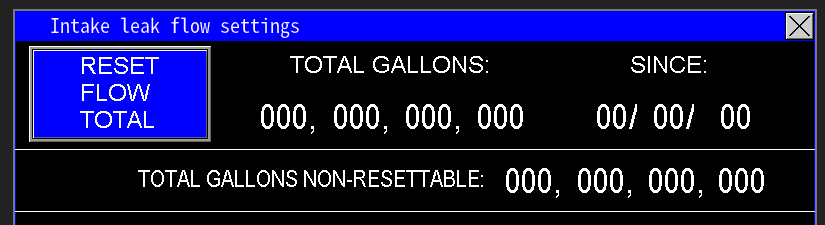
1.4 Leak flow data
High Flow fault limit and delay
The High flow limits are to help suggest to the PLC that there is a problem with intake of the pump station that needs resolved (image 1.5). It monitors the gpm flow amount, and a timer delay. The High flow fault will not fault the station, but it will send an alarm to signify that too much water is feeding back into the intake to keep it primed. In the example below, the High flow fault will alarm when the flow meter reads 3 gpm or more within 6 secs.

1.5 High flow alarm and delay
Pulse Scale and Analog Full 20mA scale
The flow meter used for the Leak flow meter works the same as all other flow meters. The difference is the flow meter is trying to detect a smaller amount of water as in a few gallons per minute vs hundreds or thousand gallons per minute. Ensure when replacing, that the flow meter going back into the station is capable of reading thousands of pulses per second vs hundreds.
Next, zero the mA Scale—this activates the pulse measurement mode. If the mA scale is not zeroed, pulse readings will not function correctly. Once configured, the system converts incoming pulses into flow rates, displaying the flow in GPM on the main screen of the HMI (Image 1.6).
The Analog Full 20mA Scale should be set to match the maximum flow rating of the flow meter’s 20mA output. This value typically represents the highest flow the meter is rated to measure. For meters with adjustable 20mA span, verify that this scale matches the configured maximum output value on the flow meter to ensure accurate readings and proper system calibration.

1.6 Scaling
Recirc Flow Meter
The Recirc flow meter monitors the total flow of water circulating through the Recirc Pump line. To configure or view the settings, access the Recirc flow parameters via the Main screen (Image 1.1) or the menu screen (Image 1.2).
 1.1 Recirc Flow Main |
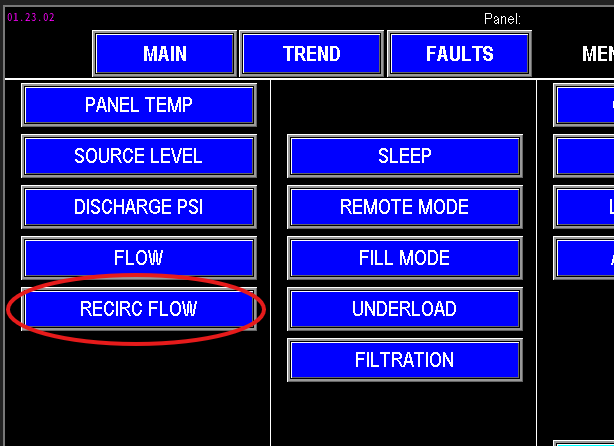 1.2 Recirc Flow menu |
Recirc Flow settings
The values entered in the Recirc flow settings are the parameters that the PLC will use to monitor and control the recirculation pump system (image 1.3). These settings ensure proper operation by providing the necessary data for the PLC to manage flow rates and respond to system conditions effectively.
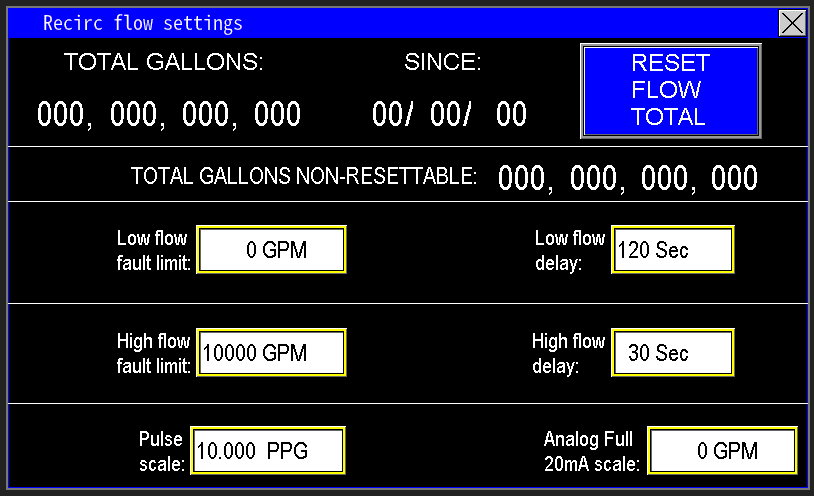
1.3 Recirc flow settings
Recirc Flow Data
At the top of the screen (image 1.4), the PLC displays the total gallons recorded by the Recirc flow meter, representing the cumulative volume that has passed through the Recirc pump line. The “since” date indicates the last time the total was reset; pressing the “Reset Flow Total” button will reset the gallons count to zero and update the “since” date to the current date shown on the HMI.
Additionally, the Non-Resettable Total gallons counter continuously records the total volume pumped by the station over its entire lifetime, and this value cannot be reset.
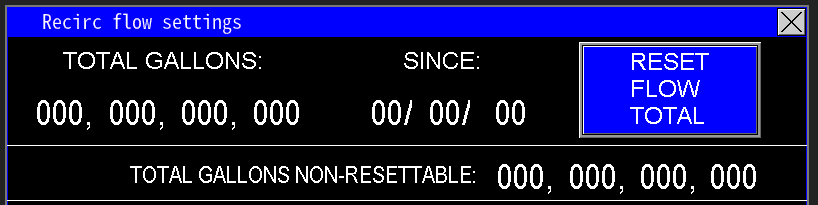
1.4 Recirc Flow Data
Low and High Flow fault limits and delays
The low and high flow limits are safety and diagnostic thresholds designed to alert the PLC to potential issues with the Recirc pump system. Both settings monitor flow in GPM and include a timer delay to prevent false alarms (image 1.5).
Low Flow Fault: The system will only fault and stop the Recirc pump if the flow remains at 0 GPM or less continuously for 120 seconds. Until this time elapses, the pump continues to run despite low flow conditions.
High Flow Fault: The system will fault and stop the pump if the flow exceeds 3000 GPM for a continuous 60 seconds. Once the delay expires, the pump is shut down to prevent damage or system issues caused by excessive flow.
These thresholds help ensure the Recirc system operates safely and efficiently by detecting flow anomalies and acting accordingly.
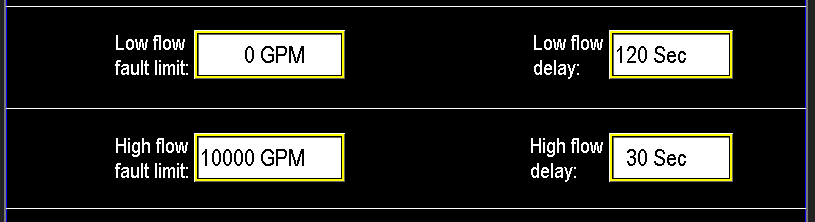
1.5 Recirc flow fault and delay
Pulse Scale and Analog Full 20mA scale
Omnia supports monitoring station, fill, recirc, and well flow meters that output pulse or analog mA signals. For pulse meters, follow the manufacturer's instructions to determine the flow meter’s k‑factor (pulses per gallon). Enter this value into the Pulse Scale setting.
Next, zero the mA Scale—this activates the pulse measurement mode. If the mA scale is not zeroed, pulse readings will not function correctly. Once configured, the system converts incoming pulses into flow rates, displaying the flow in GPM on the main screen of the HMI (Image 1.6).
The Analog Full 20mA Scale should be set to match the maximum flow rating of the flow meter’s 20mA output. This value typically represents the highest flow the meter is rated to measure. For meters with adjustable 20mA span, verify that this scale matches the configured maximum output value on the flow meter to ensure accurate readings and proper system calibration.

1.6 Transmitter scaling
Station Flow Meter
The station flow meter monitors the total volume of water passing through the main discharge line. To view or configure this flow meter, access the flow settings via the Main screen (Image 1.1) or the menu screen (Image 1.2).
 1.1 Flow main |
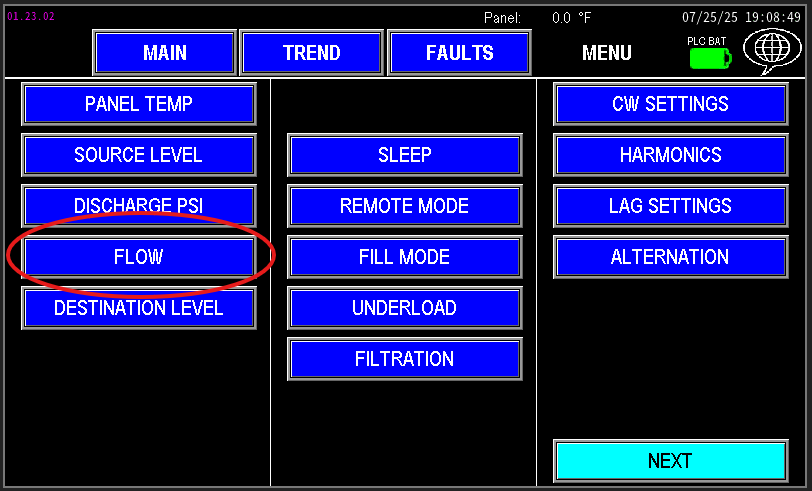 1.2 Flow menu |
Flow settings
The values entered in the flow settings (image 1.3) are the parameters that the PLC will use to monitor and control the pump station operation. These settings ensure accurate flow measurement and proper system response to flow conditions.
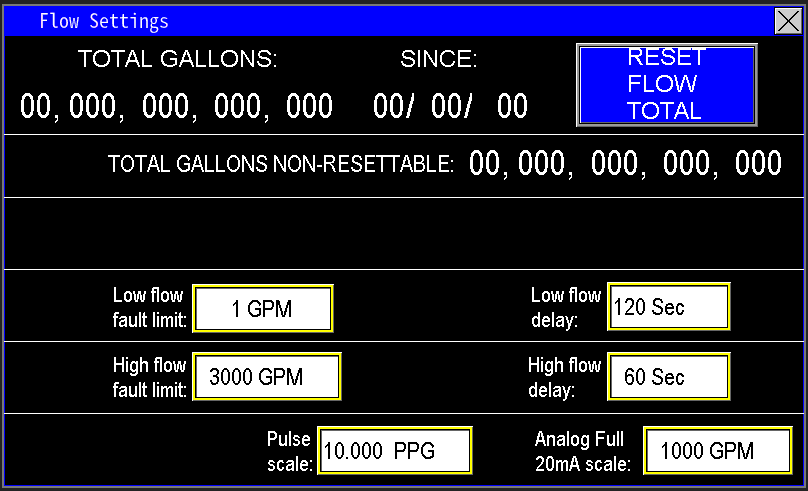
1.3 Flow Settings
Flow Data
At the top of the screen, the PLC displays the total gallons that have flowed through the station’s main flow meter (image 1.4). The “since” date indicates the last time the total flow was reset; pressing the “Reset Flow Total” button will reset this gallon count to zero and update the “since” date to the current date shown on the HMI.
Additionally, the Total Gallons Non-Resettable totalizer continually records the total volume of water pumped by the station over its entire operational lifetime. This value cannot be reset and provides a permanent record of total flow.
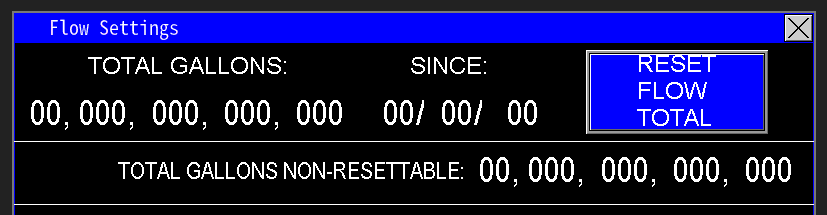
1.4 Total Gallons
Low and High Flow fault limits and delays
The low and high flow limits act as diagnostic thresholds to alert the PLC of potential issues with the station, preventing damage or inefficiency. Both limits monitor flow in GPM and include a timer delay to avoid false alarms (image 1.5).
Low Flow Fault: The station will only fault and stop if the flow remains at 1 GPM or less continuously for 120 seconds. Until that time, the station continues to run despite low flow conditions.
High Flow Fault: The station will fault and shut down if the flow exceeds 3000 GPM for a continuous 60 seconds. After the delay, the station will stop to prevent possible damage caused by excessive flow.
These thresholds help maintain safe and reliable operation by detecting abnormal flow conditions and acting accordingly.
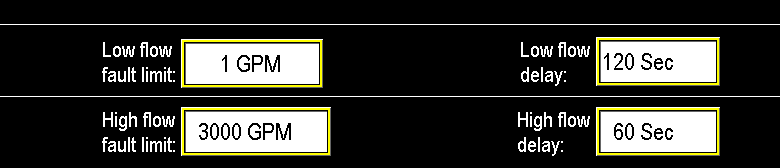
1.5 Faults and delays
Pulse Scale and Analog Full 20mA scale
Omnia supports monitoring station, fill, recirc, and well flow meters that output pulse or analog mA signals. For pulse meters, follow the manufacturer's instructions to determine the flow meter’s k‑factor (pulses per gallon). Enter this value into the Pulse Scale setting.
Next, zero the mA Scale—this activates the pulse measurement mode. If the mA scale is not zeroed, pulse readings will not function correctly. Once configured, the system converts incoming pulses into flow rates, displaying the flow in GPM on the main screen of the HMI (Image 1.6).
The Analog Full 20mA Scale should be set to match the maximum flow rating of the flow meter’s 20mA output. This value typically represents the highest flow the meter is rated to measure. For meters with adjustable 20mA span, verify that this scale matches the configured maximum output value on the flow meter to ensure accurate readings and proper system calibration.

1.6 Scaling
Well Flow Meter
The well flow meter monitors the total volume of water pumped by the well. To view or configure this flow meter, access the settings via the Main screen (Image 1.1) or the menu screen (Image 1.2).
 1.1 Well flow main |
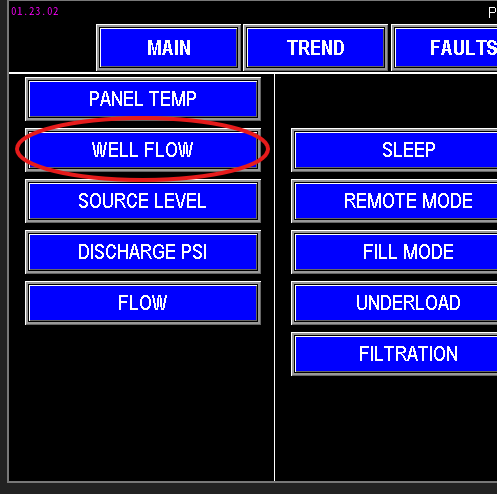 1.2 Well Flow menu |
Flow settings
The values entered in the well flow settings are the parameters that the PLC will use to monitor and control the well pump operation (image 1.3). These settings ensure accurate flow measurement and proper system response based on the well's flow conditions.
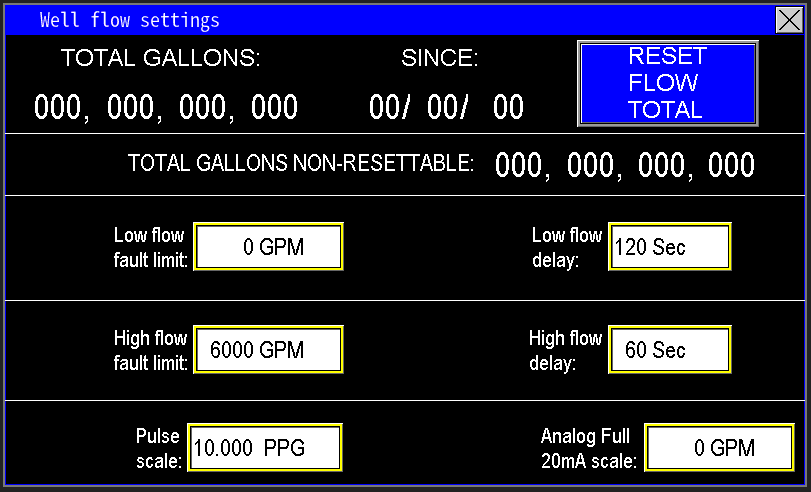
1.3 Well flow settings
Well Flow Data
At the top of the screen (image 1.4), the PLC displays the total gallons measured by the well flow meter, representing the cumulative volume pumped by the well. The “since” date reflects the last time the total was reset; pressing the “Reset Flow Total” button will reset this value to zero and update the “since” date to the current date set on the HMI.
Additionally, the Total Gallons Non-Resettable totalizer continually records the total volume of water pumped by the well over its entire operational lifetime. This value cannot be reset and provides a permanent record of total well output.
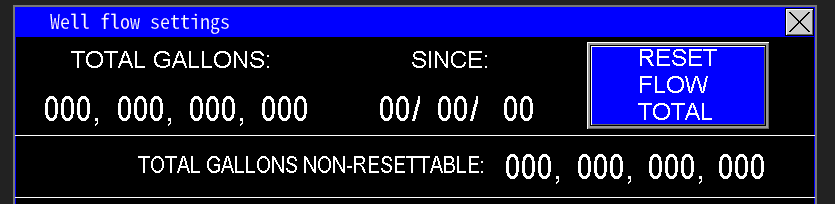
1.4 Well Flow Data
Low and High Flow fault limits and delays
The low and high flow limits (Image 1.5) serve as diagnostic thresholds to alert the PLC of potential issues with the well pump system, allowing preventive action before damage occurs. Both limits monitor flow in GPM and include a timer delay to avoid false alarms.
Low Flow Fault: The system will only fault and shut down the well pump if the flow remains at 0 GPM for at least 120 seconds. Until then, the pump continues to operate despite low flow conditions.
High Flow Fault: The system will fault and stop the station if the flow exceeds 6000 GPM continuously for 60 seconds. After this delay, the station will stop in order to prevent any damage from excessive flow.
These thresholds help ensure safe and reliable pump operation by detecting abnormal flow conditions and responding accordingly.
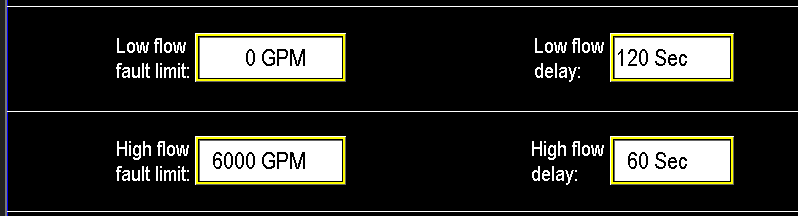
1.5 Well flow fault and delay
Pulse Scale and Analog Full 20mA scale
Omnia supports monitoring station, fill, recirc, and well flow meters that output pulse or analog mA signals. For pulse meters, follow the manufacturer's instructions to determine the flow meter’s k‑factor (pulses per gallon). Enter this value into the Pulse Scale setting.
Next, zero the mA Scale—this activates the pulse measurement mode. If the mA scale is not zeroed, pulse readings will not function correctly. Once configured, the system converts incoming pulses into flow rates, displaying the flow in GPM on the main screen of the HMI (Image 1.6).
The Analog Full 20mA Scale should be set to match the maximum flow rating of the flow meter’s 20mA output. This value typically represents the highest flow the meter is rated to measure. For meters with adjustable 20mA span, verify that this scale matches the configured maximum output value on the flow meter to ensure accurate readings and proper system calibration.

1.6 Transmitter scaling
Level Transmitters
Destination Level
These settings pertain to the tank or pond being filled by the pump station (image 1.1). They help the system determine when water demand is active — when the water level drops below a set point — and when demand has decreased — when the level reaches a specified upper limit. This allows the station to operate efficiently, filling only as needed based on the target water levels.

1.1 Destination Level Settings
Low Level alarm limits.
The level alarms in the Destination Level settings serve as notifications to alert operators of potential issues with the water level in the tank or pond being filled. These alarms do not shut down the pump station but help monitor the situation and allow for proactive responses (image 1.2).
There are three alarm levels:
- Low Level: Indicates the water level has dropped below a threshold where the system is still operating normally but needs attention soon.
- Low Low Alarm: Signals the water level is lower than ideal and could indicate a developing problem that should be investigated.
- Critical Low Alarm: Represents an urgent condition where the water level is at the lowest operational point. At this stage, there could be water shortages affecting the system's operation. Immediate action is recommended to identify possible leaks, supply issues, or upstream problems between the tank and pump station.
Properly setting these levels enables proactive management to prevent water shortages and ensure the system functions as intended.

1.2 Low level alarms
High Level alarm limit, restart trials, and delay
The station will fault when the water level reaches the High Level threshold to prevent overfilling the tank (image 1.3). This fault is temporary; once the water level drops below the High Level threshold, the restart delay begins.
In the example, with a 10-minute delay, the PLC will wait 10 minutes before attempting to restart the pumps, provided all other conditions are met. The station can repeatedly fault and attempt restarts up to the configured number of restart trials. If the station exceeds these trials—i.e., it restarts the specified number of times without resolving the underlying issue—it will enter a permanent fault state, requiring manual reset.
Once the underlying problem (such as a leak, valve issue, or sensor fault) is identified and corrected, pressing the reset button will clear the fault and allow the station to restart normal operation.

1.3 High level alarm and restarts
Transmitter Scaling
To ensure accurate level readings, match the maximum 20mA output value on the display to the transmitter’s maximum range (image 1.7). Check the transmitter’s maximum rated level and input that value into the Level Max (20mA) scale setting.
The offset setting accounts for the physical distance between the bottom of the tank and the bottom of the transmitter. This allows for proper installation without the transmitter being submerged in mud or debris that can collect on the bottom, while accurately measuring the actual water level including the space below the transmitter.

1.7 Transmitter scaling
Special Note
When the station is filling a tank, the operational approach depends on the system configuration:
Pressure-Based Fill (Standard Operation):
Most stations use pressure setpoints (Image 1.8) to fill the tank. As the tank fills, pressure approaches the setpoint, flow slows, and the station transitions to sleep mode once full. This normal operation relies on pressure control to gauge the fill level indirectly.
Destination Fill System:
When configured as a destination fill system (Image 1.7), the primary goal shifts from pressure to actual level. The system monitors the tank level via a level transmitter. Filling only occurs when the level drops to the Cut-In level (e.g., 24" of water, Image 1.9).
Once the level reaches the Cut-Out level (e.g., 120" of water), the station stops and enters sleep mode, waiting for the level to drop again before resuming.
During fill, the pump operates under level PID control until the maximum level is reached, ensuring precise level management and preventing overfill. The station will not return to sleep until the Cut-Out level is achieved, maintaining an accurate and controlled fill cycle based purely on tank level.
 1.7 System Type Fill |
 1.8 System Type Normal |
 1.9 Level cut in and out |
Source Level Settings
The source level transmitter measures the level of the water supply feeding the pump station (image 1.1). These settings configure the transmitter to ensure accurate level detection and include protection parameters to prevent damage to the pumps. Proper setup helps maintain reliable operation and safeguards the system from operating under low or excessive water levels.
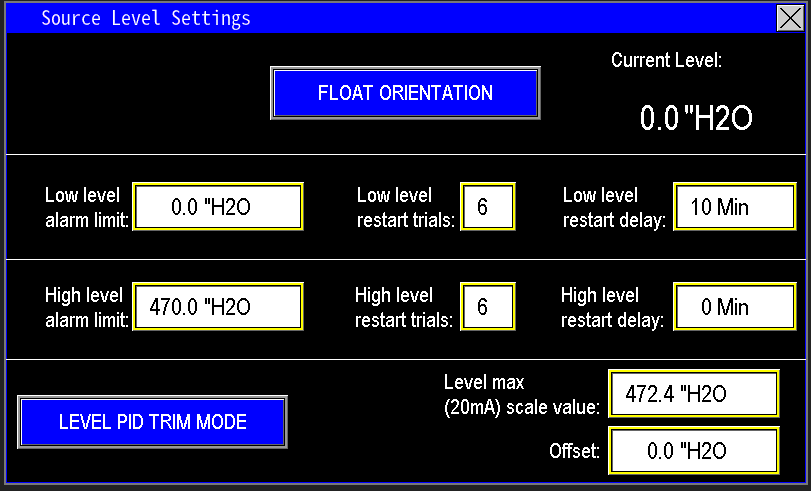
1.1 Source level
Float orientation
The float orientation setting (image 1.2) determines how the float switches are installed within the tank or water supply system. These floats are digital inputs used as backup protection in case the level transmitter malfunctions or fails. Proper configuration of the float orientation provides an additional layer of control, ensuring the pumps operate safely and prevent overfilling or running dry if the primary level measurement system is compromised.

1.2 Float orientation
Selecting the float orientation allows the PLC to interpret the float switch signals correctly. Different float switches are configured as normally open (floating) or normally closed (hanging), and choosing the correct setting is essential for proper operation.
- Floating (image 1.3): Typically refers to float switches that open or close contacts as the float rises or falls, used in certain installation orientations.
- Hanging (image 1.4): Refers to switches that hang from a fixed point and change state based on water level.
Identify the type of float switches installed at the station, then select the appropriate configuration to ensure accurate system responses and protect the pump operation.
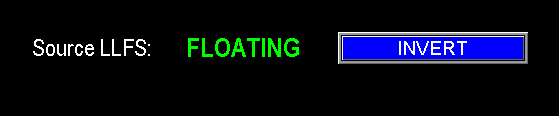 1.3 Switch type selection |
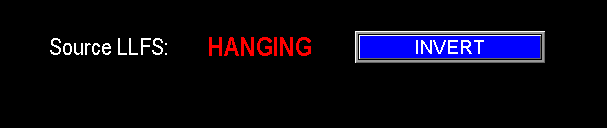 1.4 Hanging |
Low level alarm limit, restarts, and delay
The low level alarm setting (Image 1.5) prevents the pump from running when water levels are too low, protecting the system from running dry and damaging seals. When the water level reaches the low alarm limit, the alarm activates and the pump halts. The alarm remains active until water levels rise above the low level threshold.
Once water levels recover, the restart delay timer begins (e.g., 10 minutes). If water level stays above the low alarm limit during this entire delay, the pump will restart. This process can repeat for the configured number of restart trials (e.g., 6 times). If the pump fails to maintain adequate water levels after exhausting the restart attempts (e.g., hitting the 7th low level), the system will trigger a hard fault, requiring manual intervention to investigate and resolve the underlying issue causing the water shortage.

1.5 Low level alarm
High level alarm limit, restarts, and delay
The high level alarm operates similarly to the low level, but it does not cause a fault in the station itself (Image 1.6). If the station includes a well pump, exceeding the high level alarm will fault the well pump to prevent overfilling. The high level alarm remains active until water levels drop back into the normal operating range.
Once the water level falls below the high alarm threshold, the restart delay timer (e.g., 10 minutes) begins. During this period, if the level stays below the high alarm limit, the timer continues counting. After the delay expires, the alarm resets, and the well pump is allowed to operate again.
This process can repeat up to the configured number of restart trials (e.g., 6 attempts). If the high level occurs again after all retries, the alarm will remain active and will not reset until manually addressed. This indicates a potential issue with overfilling or source control that needs site inspection, and during this fault condition, the well pump will also be faulted to prevent further overfilling.

1.6 High level restarts
Transmitter scaling and offset
To ensure the level readings are accurate, set the Level Max (20mA) scale value to match the maximum level range specified on the transmitter (image 1.7). Check the transmitter's maximum rating in its documentation or directly at the device, then input that value into the Level Max (20mA) setting.
The offset represents the distance between the bottom of the tank and the bottom of the transmitter. This adjustment allows the transmitter to be installed above the tank bottom without being affected by mud or debris, while still accurately measuring the water level — including the space below the transmitter.

1.7 Scaling
Level PID trim mode
This feature enables the tank level to influence pump operation, helping to extend the water cycle by adjusting pump speed based on water level (image 1.8). Normally, the pumps operate under pressure PID control until they sleep or fault. When enabled, Level PID trim adjusts the pump speed proportionally to the level in the tank: as the water level drops, the PLC reduces the pump’s pressure setpoint (Image 1.9), allowing the pump to run at a lower pressure.
This adjustment helps the zone receive water for a longer period, albeit at a lower pressure, before the system faults or goes to sleep. For detailed operation, refer to the PID Trim Mode section under Discharge Pressure settings, which explains how level-based adjustments influence pressure control.
 1.8 Level PID button |
1.8 PID trim Mode |
Well Source Level Transmitter
The well source level transmitter measures the water level in the sump or supply source for the well pump. These settings (image 1.1) configure the transmitter for accurate level detection and include protective parameters to prevent damage to the well pumps. Proper setup ensures reliable operation and safeguards against low or excessive water levels that could harm the pump or system.

1.1 Well source level screen
Low Level alarm limit, restarts, and delay
The low level alarm prevents the well pump from operating when water levels fall too low, protecting the pump and seals from damage (image 1.2). When the low level alarm is triggered, it remains active until water levels rise back into the safe operating range.
Once levels recover, the restart delay timer begins (e.g., 2 minutes). If the water level stays above the low alarm threshold during this delay, the pumps will restart. This cycle can repeat up to the specified number of restart trials (e.g., 10 times). If the low level alarm occurs again after all attempts are exhausted (the 11th time), the system will trigger a hard fault, indicating a persistent issue. This requires site inspection to identify and fix the underlying cause of the water level problem before the pumps can be restarted.

1.2 Low level restarts alarms
High Level alarm limit, restarts and delay
The high level alarm operates similarly to the low level, but it does not cause a fault or shutdown of the well pump (image 1.3). When the water level reaches the high alarm limit, the alarm activates and remains until the level drops back into the normal operating range.
Once the water falls below the high alarm threshold, the restart delay timer (e.g., 10 minutes) begins. During this period, if the level stays below the alarm limit, the timer continues. After the delay, if the level remains below the threshold, the alarm resets, indicating a return to normal. This process can repeat multiple times, up to the configured number of restart trials (e.g., 20).
If the high level alarm occurs again after all allowed retries (e.g., on the 21st occurrence), the alarm will remain active and will not reset until manually addressed. This indicates a persistent problem with the sump or supply system, requiring site inspection to identify and resolve the issue causing continuous overfilling or high water levels.

1.3 High level restarts
Transmitter scaling and offset
To ensure the level readings are accurate, set the Level Max (20mA) scale value to match the maximum level range specified on the transmitter (image 1.4). Check the transmitter's maximum rating in its documentation or directly at the device, then input that value into the Level Max (20mA) setting.
The offset represents the distance between the bottom of the tank and the bottom of the transmitter. This adjustment allows the transmitter to be installed above the tank bottom without being affected by mud or debris, while still accurately measuring the water level — including the space below the transmitter.

1.4 Scale and offset
Misc Transmitter Sensors
Conductance
The conductivity meter measures the minerals and dissolved solids in water by assessing its electrical conductance. Higher mineral concentrations result in higher conductivity readings, typically displayed in microsiemens (µS) (image 1.1). This measurement is commonly used in systems with water purification processes such as Reverse Osmosis (RO), UV sterilization, or other treatment units to monitor water quality and ensure proper operation.
1.1 Micro siemens
Conductivity Settings
To configure or view the conductivity meter settings, navigate via the main screen (Image 1.2) or through the menu screen (Image 1.3).
 1.2 Main Screen Conductance |
 1.3 Menu Screen Conductance |
This interface allows you to configure alarm thresholds and other parameters related to the conductivity meter (image 1.4). These settings help monitor water quality and alert you to conditions that may require action based on the conductivity readings.
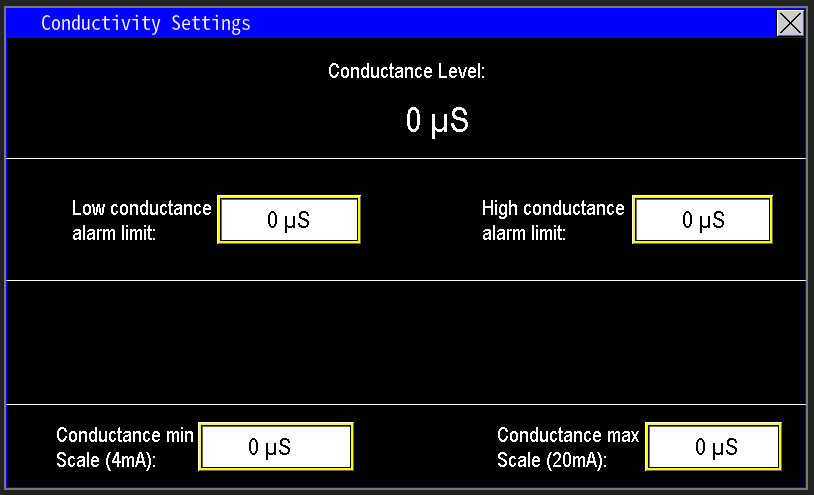
1.4 Conductivity Settings
Low and High conductance alarm limits
The low and high alarm limits can be set to thresholds that suit your water system’s requirements (Image 1.5). The current conductivity measurement is displayed on the main screen or at the top of this settings page (Image 1.1). These alarms do not shut down the system but serve as notifications to alert operators that water quality may be deteriorating or that the water treatment processes may require attention.

1.5 Conductance Alarm Limits
Transmitter scaling
The Conductance Min and Max scale values define the measurement range of the conductivity transmitter (image 1.6). The minimum pressure reading from the transmitter corresponds to the 4 mA output, and the maximum pressure corresponds to the 20 mA output. Setting these values accurately ensures proper scaling and accurate readings. The adjustable range allows for the transmitter to be replaced with one that has a different span without requiring reconfiguration of the entire system.

1.6 Transmitter scaling
Enclosure Temp
When a pump station is housed within an enclosure, such as a pump house or metal box, monitoring the internal temperature is essential to ensure proper operation and prevent overheating. The Enclosure Temp settings enable the PLC to monitor and manage the temperature inside the enclosure, alerting operators to potential issues and helping to maintain optimal conditions for system components.
Enclosure Temp Settings
The enclosure temperature settings can be accessed by pressing the button on the main screen (Image 1.1) or through the menu screen (Image 1.2). The current temperature reading from the enclosure sensor will be displayed on the main screen (Image 1.1) or within the Enclosure Temp Settings screen (Image 1.3), allowing operators to monitor and manage enclosure conditions effectively.
 1.1 Enclosure Temp Main |
 1.2 Enclosure menu screen |
 1.3 Enclosure temp settings |
Low and High Temp Alarm Limit
Configure the desired thresholds for the low temperature alarm and the high temperature alarm within the enclosure temperature settings (image 1.4). If the enclosure temperature exceeds either setpoint, the system will trigger an alarm and send a notification. This alerts operators that the temperature control units may be malfunctioning or insufficient, prompting timely intervention to prevent potential equipment damage or system failure.

1.4 Alarm Limits
Transmitter Scaling
The Panel Temp Min and Max Scale Values define the measurement span of the temperature transmitter used for the enclosure (image 1.5). The transmitter’s minimum measured temperature corresponds to the 4 mA output, and its maximum measured temperature corresponds to the 20 mA output. Setting these values accurately ensures proper scaling and precise temperature readings. The adjustable range allows for compatible replacement transmitters with different scale spans without requiring extensive reconfiguration.

1.5 Transmitter Scaling
pH sensor
A pH sensor measures the acidity or alkalinity of water, providing critical data for applications where water quality is essential for safety and system performance. In many cases, pH sensors are integrated with chemical injection systems that automatically add neutralizing agents or pH adjusters to maintain the desired pH level, ensuring the water remains safe for its intended use.
pH Settings
To navigate to the pH settings screen (Image 1.1), do so either through the main screen (Image 1.2) or via the menu screen (Image 1.3).
 1.1 pH settings |
 1.2 pH main button |
 1.3 pH menu button |
Low and High pH alarm limits
The low and high alarm limits can be set to the desired acidity or alkalinity levels for your water system (Image 1.4). The current pH reading from the sensor is displayed on the main screen or at the top of this settings page (Image 1.1). These alarms do not shut down the system but will alert operators if the pH levels fall outside the set range, indicating potential issues with water quality or injection system performance.

1.4 Alarm limits
Transmitter Scaling
The pH Min and Max Scale Values define the measurement span of the pH transmitter used in the system (image 1.5). The minimum pH measurement corresponds to the 4 mA output, and the maximum pH measurement corresponds to the 20 mA output. Setting these values correctly ensures accurate scaling and precise pH readings. The adjustable range allows for the transmitter to be replaced with one that has a different measurement span without requiring extensive reconfiguration.

1.5 Transmitter Scaling
Station Valves
Description of Station Valves
CW Valves
The CW valve setting screen is where you configure the automation that controls the CW (Clean Water) valve. The CW valve injects water back into the pump’s intake screen to clear debris and prevent large objects from entering the pump.
Configurations vary based on the pump station design:
- If all pumps share a common intake line, there will be a single CW valve to clean that main line (Image 1.1).
- If each pump has its own suction line or multiple lines are used, the HMI will display multiple CW valves corresponding to each specific pump or line (Image 1.2).
These settings are accessible via the main screen or through the menu screen, allowing for tailored control based on your station’s configuration.
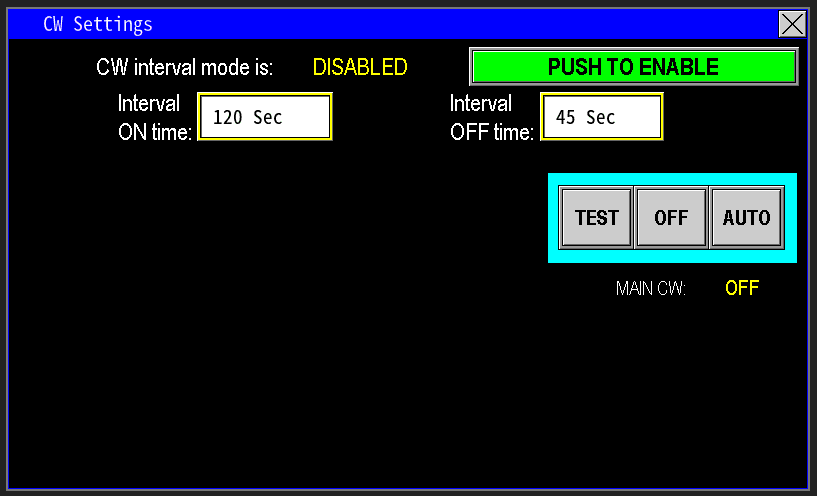 1.1 Main CW |
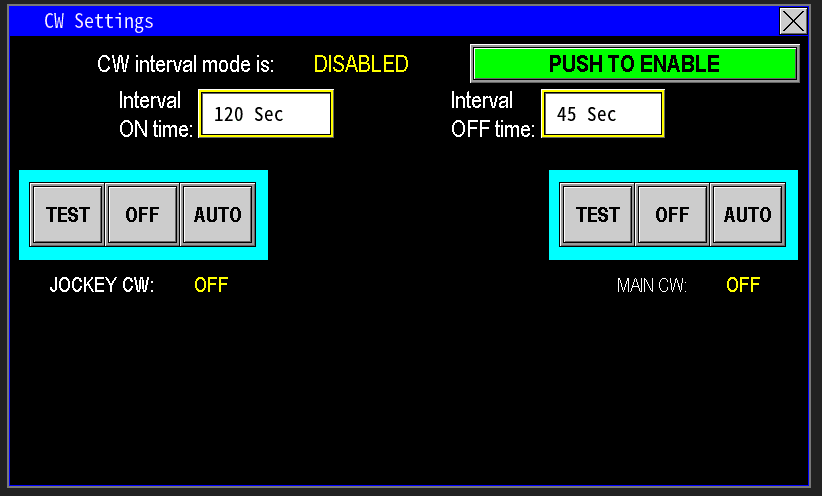 1.2 Multiple CW |
Interval mode
When enabled, Interval Mode allows the CW (Clean Water) valve to cycle on and off during designated time periods. For example, as shown in Image 1.3, the valve will remain on for 120 seconds, then turn off for 45 seconds, repeatedly cycling to optimize cleaning without continuous operation. This cycling helps the pump station enter sleep mode more effectively, especially if there is no jockey pump present.
If Interval Mode is not enabled, the CW valve will run continuously until the main pumps shut down. This ensures that cleaning occurs before the station enters sleep mode, but it may result in unnecessary cycling if not configured properly. Proper setup of Interval Mode enhances efficiency and protects the pump system.

1.3 Interval mode
Virtual HOA
The Virtual TOA (Test-Off-Auto) provides manual control over the CW valve output (image 1.4).
- TEST: Manually turns the CW valve on, bypassing PLC automation for testing or maintenance.
- OFF: Disables the valve output, preventing it from opening regardless of PLC commands.
- AUTO: Allows the PLC program to control the CW valve based on its logic and any interval settings configured.
If multiple CW valves are installed, each one will have its own HOA control on the HMI, enabling independent operation and management of each cleaning line.
1.4 HOA
Filtration and Filter Settings
The Filtration tab provides a comprehensive overview of all filters installed on the station (image 1.1). This is also accessible via the main screen (image 1.2). It displays the current status and activity of each valve, helping operators quickly assess what each valve is doing and its operational state. Additionally, this tab allows for quick access to control individual valves directly or to enter each filter’s settings. In the settings, you can review and adjust parameters specific to each filter, ensuring optimal performance and maintenance management.
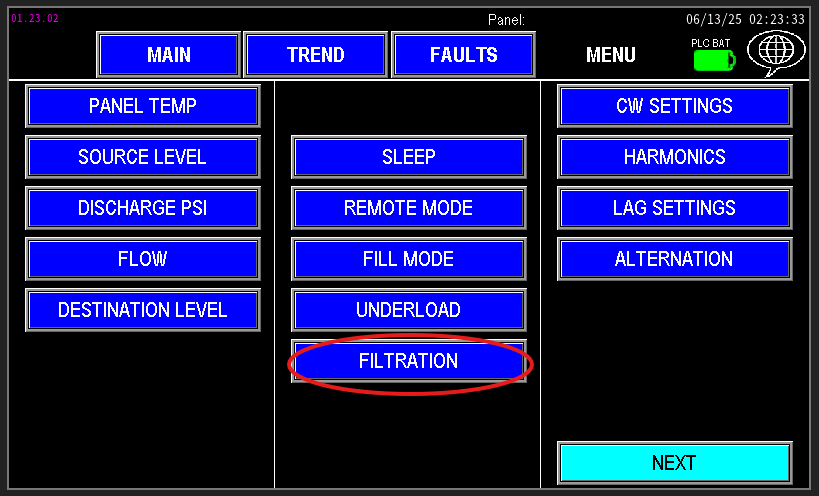 1.1 Filtration |
 1.2 Filters |
Once accessed, the filtration screen will display a list of all filters connected to this pump station (image 1.3). It provides detailed information on each filter's current status and allows for individual control or configuration of settings specific to each filter component.
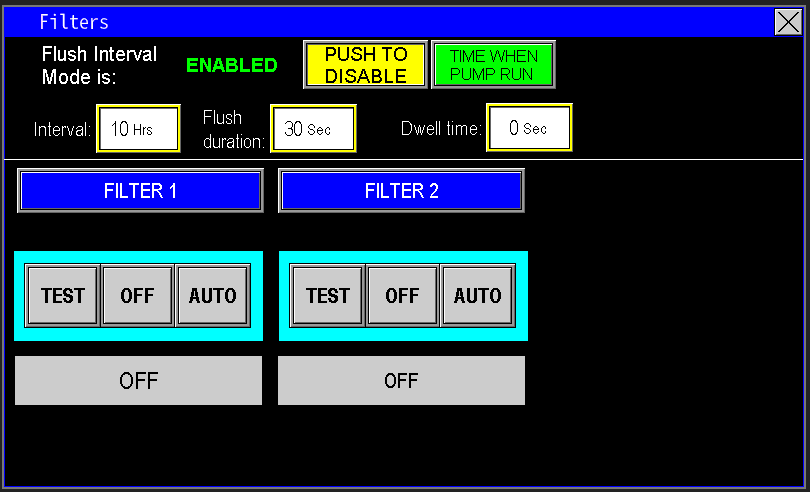
1.3 Filters
Flush Interval Mode
When enabled, the Flush Interval Mode activates a schedule for automatic filter flushing based on time intervals. This is especially useful when water quality is inconsistent, allowing the station to maintain clean filters by flushing at a set rate measured in hours (image 1.4).
"Time When Pump Runs" Button:
This option ensures the interval countdown only advances when the pumps are actively running. For example, if the interval is set to 10 hours, the timer will count only the hours during which the pump is operating (as in the example below, (Image 1.3).
- If enabled, the flush will only occur after the pump has been running for the specified number of hours.
- If disabled, the flush will trigger every set number of real hours regardless of pump activity.
Automatic Reset:
If a filter trigger occurs before the timer completes, the timer will reset and start counting down from the full interval again.
Dwell Time:
This setting applies to systems with multiple filters, controlling the time gap between the first filter’s flush stopping and the second filter’s flush starting, ensuring proper sequencing and back-to-back cleaning cycles.
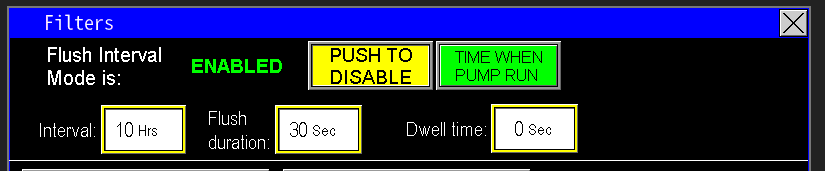
1.4 Flush Interval
Virtual HOA
The Virtual HOA allows manual control over the filter operation (Image 1.5):
Test:
Manually cycles the filter valve on and off, useful for testing or manual flushing procedures. If the filter includes a flushing motor, this mode will also activate that motor to perform the proper cleaning cycle.
Off:
Disables the filter operation, turning the valve and flushing motor off.
Auto:
Enables PLC automation to control the filter's flushing cycle based on configured schedules and sensor inputs.
To adjust specific parameters or setpoints for an individual filter, select that filter from the list and access its detailed settings. These can also be accessed quickly from the main screen by clicking the filter button (Image 1.6).
All filter screens share a similar layout and interface, providing a consistent user experience. Depending on the specific pump station configuration, the automation control logic may vary slightly—for example, whether the filter includes a flushing motor or not. However, most control features and settings are present across all configurations, ensuring comprehensive management and easy operation regardless of the filter type installed.
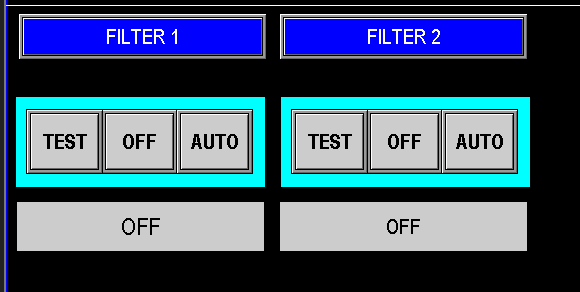 1.5 Virtual HOA |
 1.6 Filter |
Filter Usage
At the top of the filter screen (image 1.7), the display shows the total hours of filter operation for this station. In configurations without a flushing motor, these hours represent how long the filter valve has been open or active. If the filter includes a motor to assist with flushing, the hours also indicate the total runtime of that motor during flush cycles. This information helps track filter activity and maintenance needs.
Cycle Count and Reset Information
Cycles: Indicates how many times the filter flush sequence has been initiated and the filter has been activated. This helps track usage and frequency of cleaning cycles.
Since: Shows the date and time when the hours and cycle count were last reset, such as after maintenance or component replacement.
Reset Hours Button: Pressing this button resets both the hours and cycle count to zero and updates the “since” date to the current date and time on the HMI, providing a fresh starting point for monitoring filter activity.

1.7 Hrs, Cycles, Since
Flush Interval Mode
When enabled, the Flush Interval Mode activates a schedule for automatic filter flushing based on a set time interval, measured in hours. This is particularly useful when water quality is variable, ensuring the filter remains clean by flushing at regular, user-defined intervals (image 1.8).
"Time When Pump Runs" Button:
This option allows the interval timer to only accumulate during periods when the pump is actively running.
- For example, if the interval is set to 10 hours (as shown in Image 1.9), the timer will count only the hours that the pump is operating before triggering a flush.
- If this option is disabled, the filter flush will be triggered every 10 real hours regardless of pump activity.
Automatic Reset:
If a flush command occurs before the timer completes, the timer resets and begins counting down again from the full interval after the flush, ensuring consistent schedule adherence.
This setup helps maintain clean filters efficiently, especially in systems with fluctuating water quality.
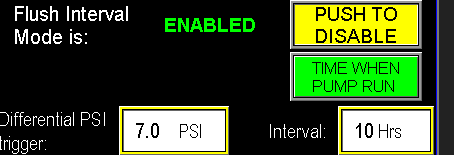
1.8 Interval mode
Differential PSI trigger and delay
Traditionally, filters with a PSID switch rely on a mechanical device to detect when pressure difference indicates a dirty filter. When the switch closes, it signals the PLC to initiate a flush. However, PSID switches can fail over time, leading to potential undetected dirt buildup.
With Omnia and the addition of a pre-filter pressure transmitter, the system can now measure the pressure difference directly through the PLC by monitoring two transmitters: upstream and downstream of the filter.
The differential PSI trigger (Image 1.9) is adjustable, allowing operators to set the pressure difference threshold. When the PLC detects that the pressure differential exceeds this setpoint, it starts a delay timer. If the pressure difference remains above the setpoint for the duration of this timer, the PLC will automatically initiate the filter flush, ensuring continuous monitoring and eliminating dependence on the mechanical switch.
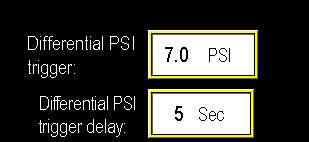
1.9 Differential trigger and delay
Virtual HOA and push to test valve
For filters equipped with a motor that operates during the flushing cycle, the control screen (Image 2.0) includes a "Push to Test" valve button. When pressed, this button allows independent testing of the valve itself without activating the motor, and the status of the test is displayed below.
In configurations where the filter does not have a motor (Image 2.1), this test button is not visible. Instead, the virtual HOA (Image 2.2) uses its own control to turn the filter flush valve on, providing a manual override or test function separate from the motorized flushing sequence.
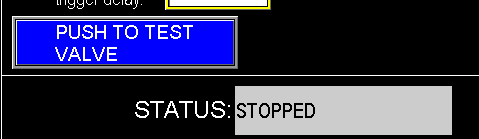 2.0 Push to test valve |
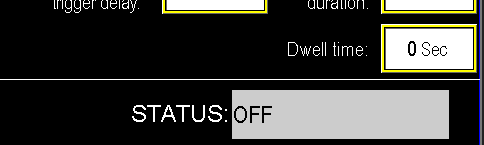 2.1 |
In configurations where the filter includes a motor, the test button on the Virtual TOA (Test, Off, Auto) will activate both the filter valve and the flushing motor to run the full flush sequence manually (image 2.2). Before performing this test, verify that any limit switches or safety devices on the motor are functioning correctly to prevent damage or safety issues.
- TEST: Manually turns on both the filter valve and the flushing motor simultaneously. This allows for testing the entire flushing operation manually. The system will keep both the valve and motor on until it is switched to OFF or AUTO mode.
- OFF: Turns off the entire filter system, stopping both the valve and the motor.
- AUTO: Allows the PLC automation to control the filter flushing process based on your system’s programmed logic and schedule.
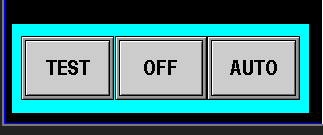
2.2 Virtual HOA
Dwell time and flush duration
In systems with two filters, each filter will have its own dwell time and flush duration settings (image 2.3).
Flush Duration:
This is the length of time the filter’s flush cycle runs each time it is activated.
Dwell Time:
This is the waiting period between the end of one filter’s flush and the start of the other filter’s flush cycle, ensuring proper sequencing and avoiding simultaneous operation.
These settings help coordinate the cleaning cycles to maintain filter effectiveness while optimizing system performance.
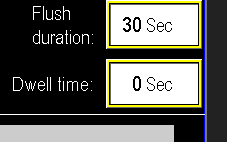
2.3 Flush duration and dwell time
Prime Assure Valve
Prime Assure is a system that feeds discharge pressure back to the pump intake to keep the intake line primed while the station is asleep. By maintaining prime, it eliminates the reprime delay when the station wakes. If configured, the Prime Assure valve (see image 1.1) is accessible from the main screen.

1.1 Prime Assure
Prime Assure Settings
The Prime Assure settings (image 1.2) control the automation for the Prime Assure system. The top of the screen displays flow data for the Prime Assure valve, showing how much water is being returned from the discharge to the intake to maintain prime. This is broken into two sections:
Current Cycle
- Total gallons: gallons flowed into the intake during the current cycle
- Total time: time taken for that flow
Last Cycle
- Total gallons: gallons flowed into the intake during the previous cycle
- Total time: time taken for that flow
These values indicate how well Prime Assure is maintaining prime and can reveal intake issues (e.g., a faulty foot valve or intake leak).
Below the cycle data is Gallons Allowed per Cycle — a maximum expected return volume before an intake leak must be addressed. If flow exceeds this limit, the station will alarm. Stations with Prime Assure include a pressure tank to help maintain discharge pressure while water is diverted to the intake; if the allowed gallons must exceed the tank’s full capacity, check or replace the tank or inspect the intake for leaks.
The next section automates expected flow and timing when the station goes to sleep. Because discharge pressure exceeds intake when sleeping, some flow to the intake is normal. In the example, the PLC expects at least a 0.3 PSI rise in the intake within 20 seconds; if met, the system remains normal. If not, the PLC faults the Prime Assure system. Disabling this feature causes the PLC to ignore these checks.
Finally, the virtual HOA controls the Prime Assure valve: Hand energizes the valve, Off closes it, and Auto returns control to the station automation.

Injection Valves
Injection valves are essential components added to stations that introduce chemicals or other substances into the water flow during pumping. These valves work alongside the injection pump to precisely control the amount and timing of the substance being added, ensuring consistent and effective dosing for water treatment or other operational requirements.
Pump Injector Valve Settings
To access the Injector Valve settings:
- Start from the main screen (Image 1.2), and enter the Injector Pump settings.
- Within the Injector Pump menu, click on "Injection Valves" (Image 1.3).
This will take you to the Injector Valve configuration screen (Image 1.1), where you can set up and adjust the valve parameters.
1.1 Injection Valve Settings |
1.2 Injection Pump |
1.3 Injection Valve |
On/Off Delay
Within the injector valve configuration, two timer delays help ensure proper priming and prevent air pockets in the injection line (Image 1.4):
"Injector to Valve ON Delay":
This timer controls how long the injector pump runs before opening the valve. After the set delay (e.g., 10 seconds), the valve opens, allowing chemical injection into the main line.
"Valve to Injector OFF Delay":
Following the closing of the valve, this timer waits for a specified delay (e.g., 5 seconds) before turning off the injector pump. This ensures the line is fully filled with chemical and prevents gaps in injection.
Example Sequence:
The injector pump starts, waits 10 seconds, then the valve opens and injection begins. When the main system is shutting down or the pumps turn off, the valve closes, waits 5 seconds, and then the injector pump stops. This sequence maintains continuous chemical presence in the line without gaps.

1.4 Injector valve on/off delay
Virtual Operators
The bottom section (image 1.5) displays the virtual operator controls for each injection valve installed on the station:
- "Test": Manually activates the valve, keeping it on until the operator deactivates it or switches the mode.
- "Off": Shows the valve is in its resting state, not being controlled by manual commands or automation.
- "Auto": Enables the PLC-controlled operation, allowing the valve to open and close according to the programmed automation sequence and set parameters.
These controls provide flexible management, allowing manual testing or automatic operation based on system needs.
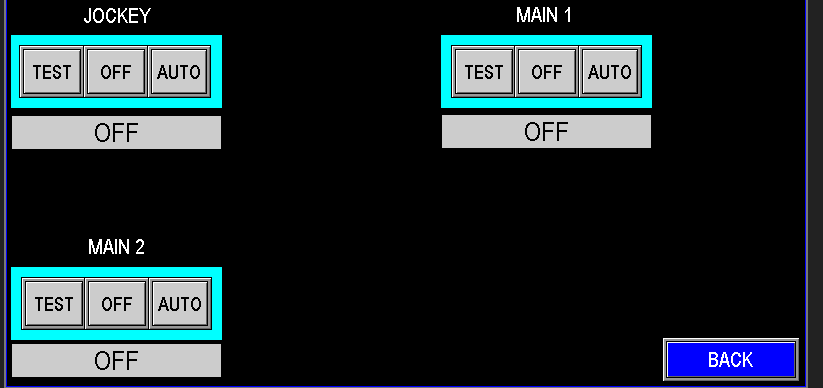
1.5 Virtual Operators
Scrubber Valve
To access the scrubber valve settings:
- Enter the Injection Pump system via the main screen (Image 1.1).
- Once in the injection system, click on "Scrubber Valve" (Image 1.2).
This will bring up the scrubber valve configuration, allowing you to set up and manage its operation in conjunction with the injection pump for enhanced cleaning of the system.
1.1 Injection Pump |
1.2 Scrubber Valve |
Scrubber Valve Settings
Within the scrubber valve configuration (image 1.3), you can adjust automation parameters that optimize its operation. These settings enable the PLC to control the timing, duration, and sequence of the scrubber's cleaning cycle, ensuring effective system maintenance and integrating the scrubber function with overall station automation.
1.3 Scrubber Valve Settings
Virtual Operator and Status
The virtual operator functions similarly to other system controls (image 1.4):
- "Open": Engages the signal to open the scrubber valve. It will stay open until manually closed or switched back to auto mode.
- "Close": Engages the signal to close the valve. It remains closed until manually opened or set to auto mode.
- "Auto": Allows the PLC’s automation logic to control the valve according to scheduled cycles or operational conditions.
Below these controls, the current operational status of the valve is displayed, indicating whether it is OFF/Closed, ON/Open, in AUTO mode, or IDLE, providing clear real-time status feedback.
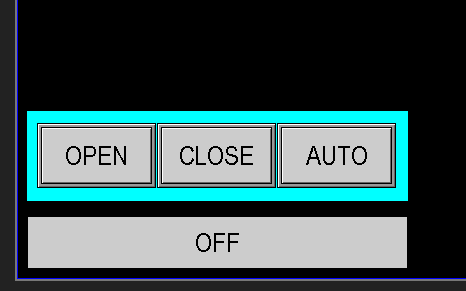
1.4 Virtual Operator
Valve On and Off Delays
The delay settings for the scrubber valves operate similarly to those of the injection valves but in reverse (image 1.5):
"Scrubber to Injector ON Delay":
This timer controls how long the scrubber valve remains open before the injector pump is turned on. After the specified delay, the injector pump activates to assist with cleaning.
"Injector to Scrubber OFF Delay":
Once the cleaning cycle is complete, the injector pump is turned off, then this delay timer counts down before closing the scrubber valve. This ensures the system is properly flushed and prevents abrupt shutoffs.
These delays help coordinate the scrubber and injector pump operation for effective cleaning cycles.

1.5 On/Off
Menu Screens
Being familiar with the HMI interface—including which screens are accessible from both the menu base and the main screen—can significantly improve troubleshooting efficiency. Quick navigation allows operators to quickly identify and resolve issues, minimizing station downtime. Familiarity with station components and their locations on the screens helps in diagnosing malfunctions swiftly and ensures smooth, continuous operation.
Activation
The Activation tab (image 1.1) should only be used by authorized personal. If the panel is no longer in demo mode, and activation is required, contact PPS for more information.
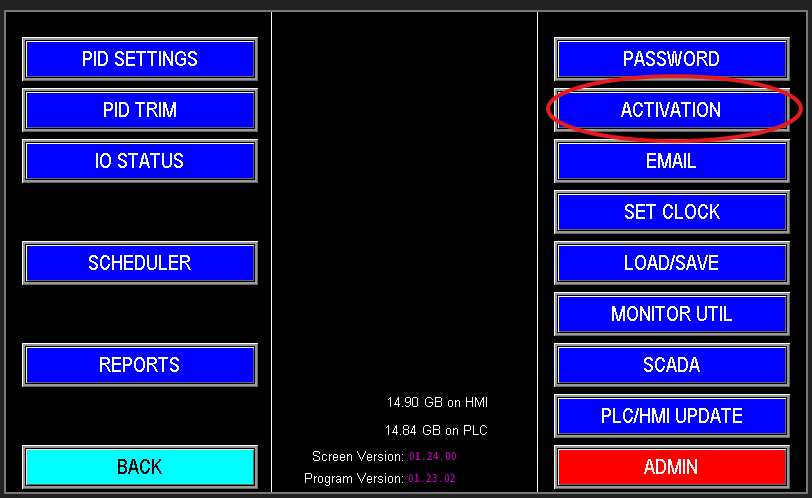
1.1 Activation
Emails
The Omnia program can automatically send email or text alerts to operators when a station shuts down, including the reason for the shutdown (Image 1.1). It can also be configured to send water usage reports if required. This proactive communication enables faster troubleshooting, often before arriving on-site.
Additionally, by integrating with the Clarity Package or through remote login, operators can start, stop, and reset the station remotely, providing significant time savings and operational flexibility. Note: Remote control and notifications require a configured modem on the panel and an active service plan—without these, remote notifications and control are not available.
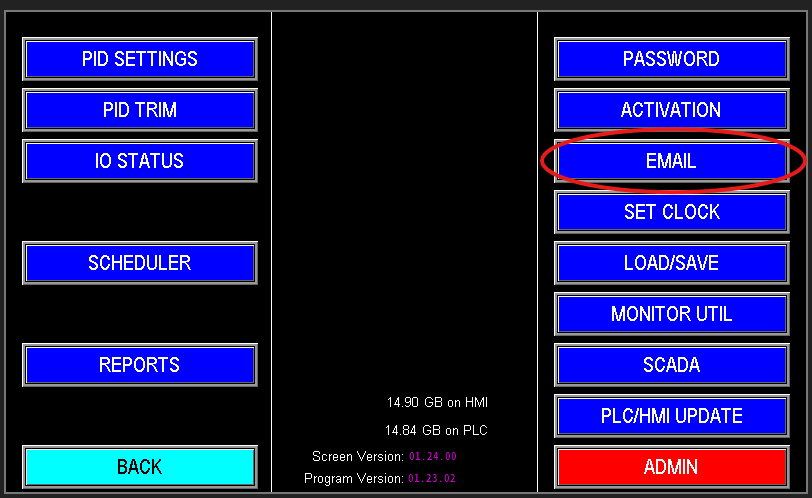
1.1 Email
Email Settings
When accessing the email screen, the primary section that typically requires configuration is the email input field (image 1.2). Enter the desired email address and click “Send Test” (Image 1.3). The status bar at the bottom right will inform you whether the test was successful or if an error occurred. If an error does occur and the system status shows something like image 1.4, see below under “Configure” for those settings. Once you receive a successful test message, your email setup is complete. After this, the system will automatically send email notifications for all fault events to all addresses entered.
For text message notifications, you can set up phone numbers as email addresses—most carriers support receiving texts via email. Simply search online for the correct email-to-text gateway for the service provider, then enter the generated email address in the same email input field. This allows fault notifications to be received as texts, providing quick alerting directly to operators’ mobile phones.
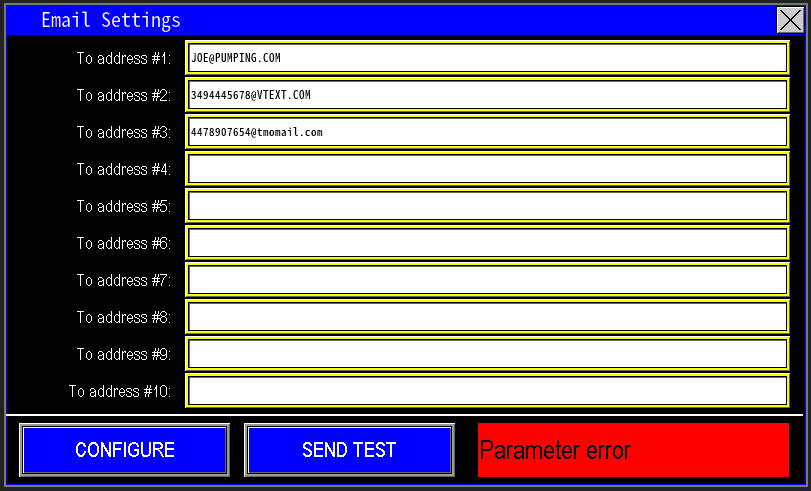 1.2 Emails |
 1.3 Test |
 1.4 Parameter |
If configuring an a text to a number, here are a couple of services listed on how to properly set this up. If carrier is not listed below (image 1.5), search online for how to set it up.
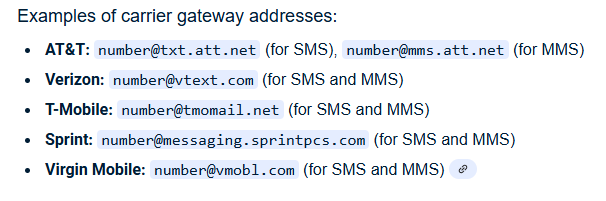
1.5 Carrier gateway addresses
Configure
If emails are not being sent successfully, start by verifying that the email addresses entered are correct and properly formatted. If the addresses are correct and your service subscriptions are active, the next step is to check the server settings.
- Click the configure button next to "Send Test" (Image 1.6).
- On the setup screen (Image 1.7), click "Set Defaults" to load factory-provided server and port information automatically.
- After setting defaults, return to the previous email screen and try sending a test email again.
Note: If emails still fail to send after restoring defaults, contact PPS for further assistance to diagnose and resolve the issue.
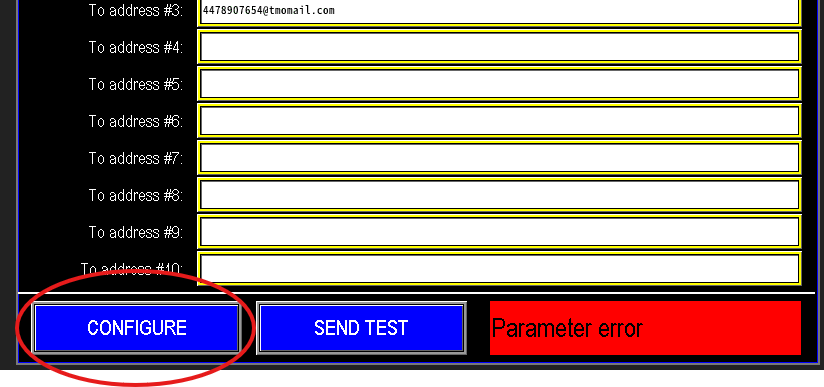 1.6 Configure |
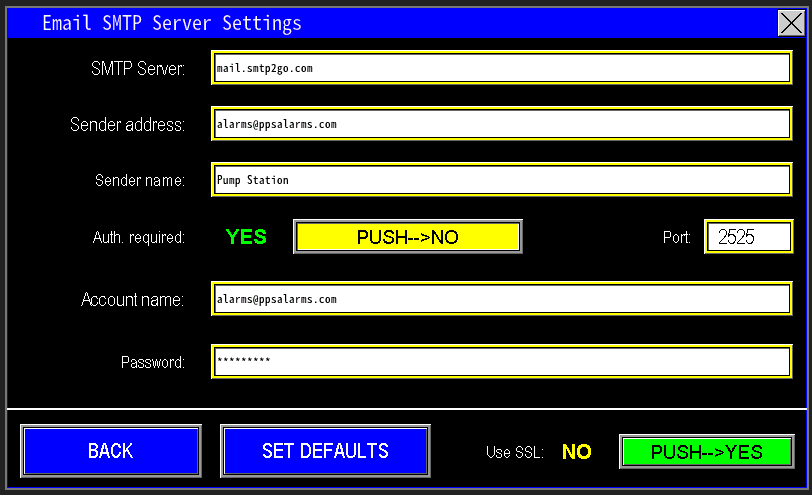 1.6 Email SMTP settings |
Fill Mode
When stations start up for the first time or after a power outage, line pressure may be extremely low. Rapidly ramping pump speeds to meet the normal pressure setpoint can stress downstream valves and components, potentially causing damage or delays for repairs.
Line Fill Mode mitigates this risk by setting a lower, more gradual pressure setpoint. This allows the pumps to fill the system slowly and safely (Image 1.1), ensuring pressure builds up in a controlled manner and reducing the likelihood of equipment stress or failure during startup.
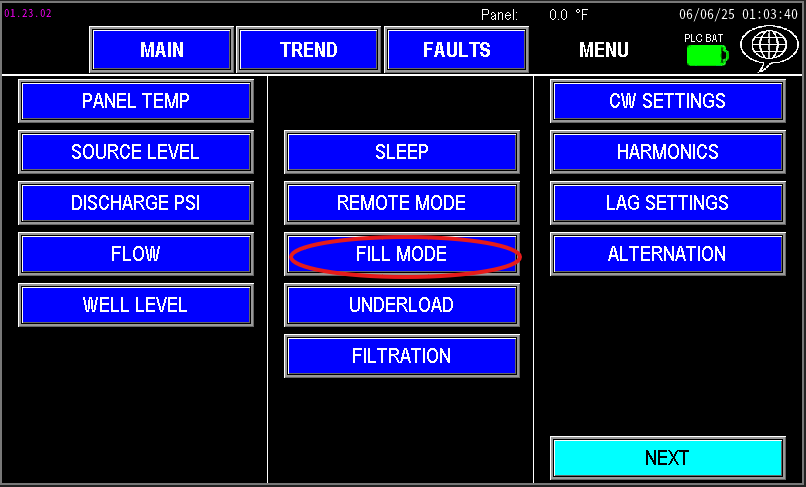 1.0 Fill Mode Button |
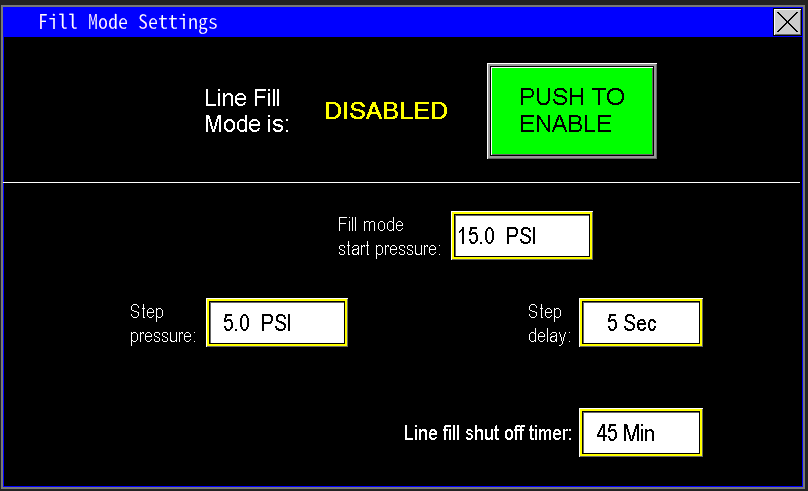 1.1 Fill Mode settings |
Fill Mode Start Pressure
When fill mode is enabled, the Start Pressure setting determines the pressure threshold at which the system switches into line fill mode to protect downstream components. Setting this value according to station specifications is important for proper operation.
For example, in Image 1.2, the fill mode activates whenever the pressure drops below 15 psi. Once activated, the system scales down the pressure setpoint to a lower value, slowing pump operation to safely fill the system gradually and prevent stress or damage to downstream assets.
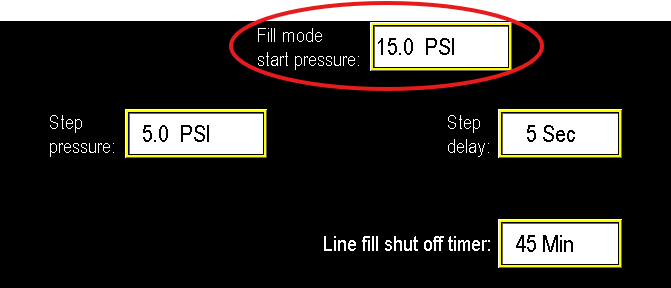
1.2 Fill mode start pressure
Step pressure
When fill mode is enabled, the Start Pressure setting determines the pressure threshold at which the system switches into line fill mode to protect downstream components. Setting this value according to station specifications is important for proper operation.
For example, in Image 1.3, the fill mode activates whenever the pressure drops below 15 psi. Once activated, the system scales down the pressure setpoint to a lower value, slowing pump operation to safely fill the system gradually and prevent stress or damage to downstream assets.
When in fill mode, the pump gradually increases its speed to reach the temporary, lowered pressure setpoint (e.g., 15 psi). Once the system maintains this pressure for the duration of the step delay, the control system steps the setpoint upward by a designated amount (e.g., +5 psi, moving to 20 psi). The pump then ramps again to meet this new setpoint.
This process repeats—raising the pressure setpoint incrementally—until the system reaches the normal operating pressure. At that point, the station shifts back to normal operation, maintaining the standard pressure setpoint for ongoing operation. This controlled, stepwise approach prevents sudden pressure surges and reduces stress on downstream components during startup or low-pressure conditions.
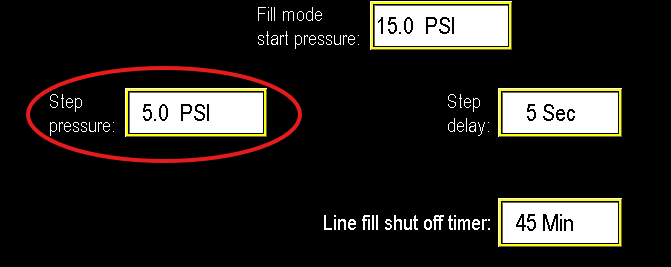
1.3 Step Pressure
Line fill shut off timer
The line fill shut-off timer (image 1.4) indicates the expected duration needed for the station to fill the line when fill mode is activated. Because each pump station varies, the time required to pressurize the system can differ; the key is to monitor how pressure builds during this process.
If the timer expires before the system reaches adequate pressure, the station will fault. If no pressure gains are observed, inspecting the discharge lines and pump station for leaks or blockages is recommended. Conversely, if pressure is gradually increasing but the timer times out prematurely, consider extending the timer to allow full pressure buildup during fill mode.
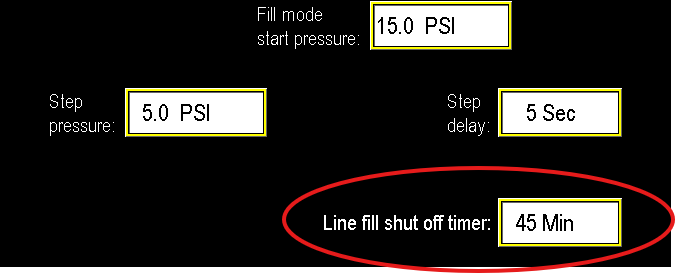
1.5 Line fill shut off timer
IO Status
The IO Status screen displays real-time data on all inputs, outputs, and analog signals within the station. It provides an at-a-glance view of current sensor readings, valve statuses, relay states, and signal values. This makes it an invaluable tool for troubleshooting, verifying proper operation, and observing how the station responds to various conditions. If the station is acting unexpectedly or reacting oddly, the IO Status screen is the ideal place to monitor exactly what signals and signals states the system is detecting at that moment.
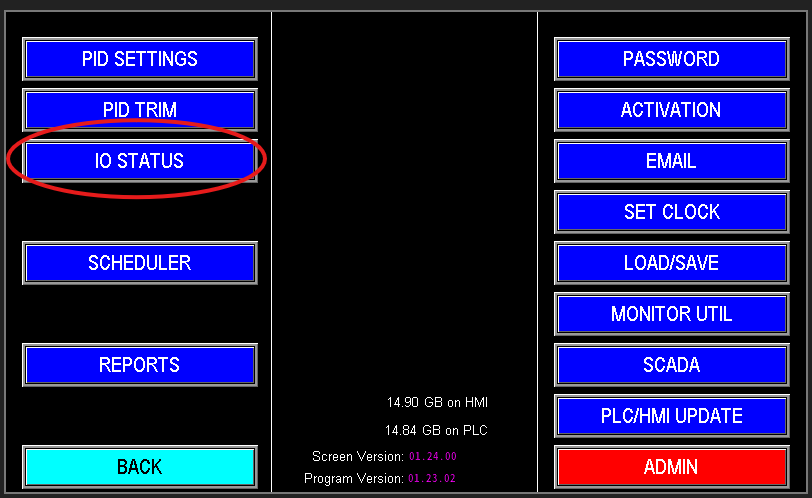
1.1 IO status
This screen lists all configured inputs and outputs for the job (image 1.2). A green indicator next to an input (e.g., I0, I1, I3, I5, I7, I30, I31, I40) shows it is actively receiving a signal, meaning it’s turned on or detects an active state.
On the output side, Q3, Q4, and Q5 are turned on and supplying power to their respective devices, such as VFD contactors. To monitor the analog signals, click on the "Analog" button located in the bottom right of the screen. This allows you to view real-time analog input and output values for precise system monitoring.
- When the bottom of the screen says “Digital” (Image 1.3), you are viewing the analog input/output signals.
- When it says “Analog” (Image 1.4), you are viewing the digital input/output signals
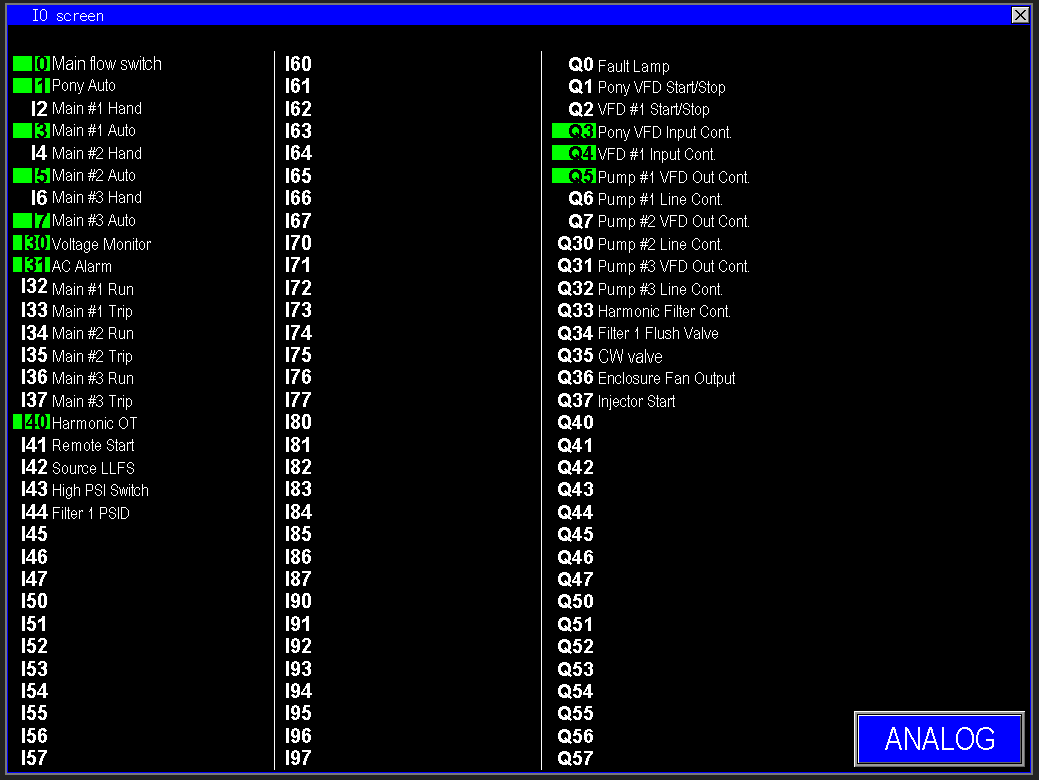
1.2 Inputs and outputs monitoring
The PLC outputs (image 1.3) a 4–20mA control signal to the Variable Frequency Drive (VFD), which converts this current into a corresponding frequency (Hz) to regulate motor speed. At the lower end, 4mA represents the minimum operational frequency, while 20mA corresponds to the maximum setpoint. This proportional control methodology allows for precise and accurate modulation of motor speeds and device operations, ensuring smooth system performance and optimal process control. Additionally, these analog outputs can represent positional signals for modulating valves or transmit sensor readings to a SCADA system for comprehensive remote monitoring and control.
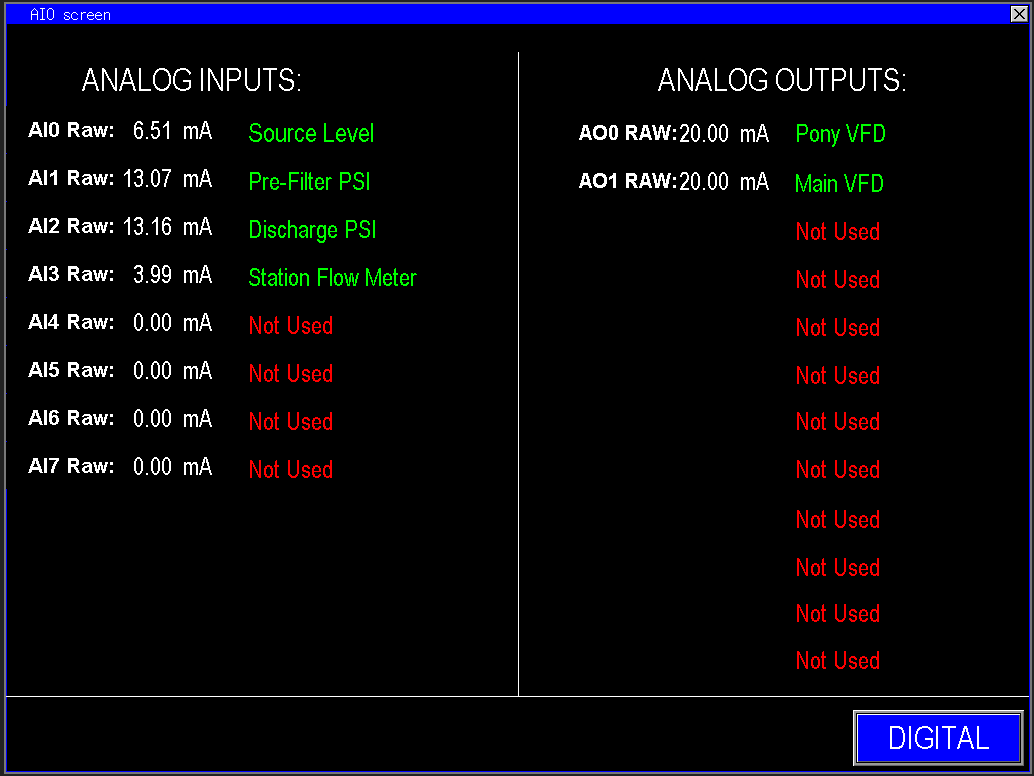
1.3 Analogs
Load/Save
The Load/Save screen is a crucial tool for operators, allowing them to save the optimal configuration of the station when it is performing at peak efficiency. This feature provides a straightforward way to store all current settings and configurations, enabling quick restoration if the station’s performance begins to decline.
During troubleshooting, settings are often adjusted to identify and correct issues. However, some changes may inadvertently affect station performance or revert to less efficient states. Using the Load/Save function ensures that operators can easily restore the station to its best-known configuration after troubleshooting, saving time and minimizing the risk of unintentional errors impacting reliability. This helps maintain consistent, optimal operation and reduces downtime caused by configuration drift during maintenance or repairs.
The Load/Save screen provides three configuration profiles: User Settings 1, User Settings 2, and Factory Calibration (Image 1.1). The two user profiles offer flexible options for different operating conditions, such as varying zone sizes or application-specific adjustments. This allows operators to tailor station operation for different scenarios and quickly switch between configurations with a single click.
- To save the current station setup to a profile, click “Save” and select the desired profile. This stores all active settings onto that profile for future use.
- To revert the station to previously saved settings, click “Load” and select the relevant profile. The system will then restore all settings stored in that profile onto the station.
Factory Calibration represents the original factory setup. If the station’s performance degrades or changes after troubleshooting, restoring to factory calibration can reset all configurations to the original, ensuring a fresh start and helping to bring the station back to its baseline operational state—assuming underlying issues have been resolved.
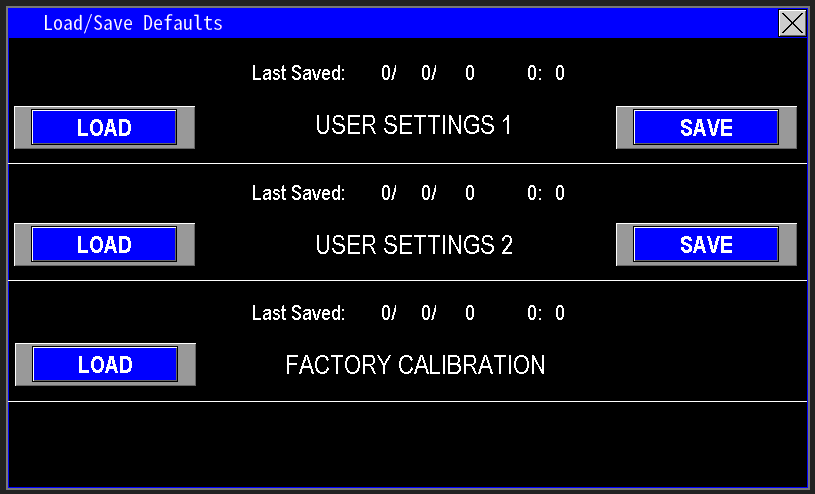
1.1 Load Save
PID Settings
PID is a control algorithm used to maintain a system at its desired setpoint by continuously adjusting the output to react to real-time conditions (image 1.1). When controlling motors via VFDs, PID enables smooth and precise regulation of pump speed based on parameters such as pressure, flow, or level.
This control method minimizes fluctuations, improves stability, and ensures consistent system performance by automatically compensating for variable changes and disturbances, resulting in efficient and reliable operation.

1.1 PID button
PID Gain and Integration
When tuning the PID control in the PID settings screen, two primary parameters are adjusted to achieve smooth and stable motor operation (image 1.2):
Gain:
Determines how aggressively the system responds to errors. Higher gain results in a faster response but may cause overshoot or oscillations, while lower gain provides a smoother response but may be slower to react.
Integration:
Controls how the PID responds to accumulated errors over time. Proper adjustment helps eliminate steady-state errors and improves stability. Too much integral action can cause overshoot, while too little may lead to persistent offset.
All motors configured with a VFD will be displayed on this screen, allowing operators to fine-tune their control parameters for optimal performance. Additional setpoints and parameters will be discussed below to ensure comprehensive tuning and system stability.

1.2 PID screen
Gain
The gain parameter (image 1.3) directly influences how the control system responds to the difference between the current process variable (e.g., pressure) and the setpoint. It determines the proportional response of the output:
Lower Gain:
Produces a more gradual response, reducing overshoot and undershoot, and allows the PLC to target a value closer to the setpoint. While this results in a slower approach to the target, it minimizes oscillations and provides stability.
Higher Gain:
Increases the system's responsiveness, allowing the process variable to reach the setpoint more quickly. However, excessive gain can cause the VFD to ramp up and down rapidly, leading to oscillation and instability, making the control less smooth.
Optimal gain settings balance speed and stability, ensuring responsive yet stable control without causing excessive oscillation or sluggish behavior.

1.3 Gain
Integration
The integration parameter, often called the I time, determines how quickly the control system responds to accumulated errors or offsets from the setpoint (image 1.4). When the system is stable but shows a slight offset, increasing the I time causes the controller to apply corrections more rapidly, helping the process variable move closer to the target value.
However, setting the I time too high can lead to overshoot and oscillations, while setting it too low results in slower correction and may leave the process offset for longer periods. Adjusting the I time allows fine-tuning of how quickly the control system reacts to persistent errors, balancing responsiveness with stability for optimal process regulation.

1.4 I time
Derivative
The derivative component (image 1.5) predicts future process behavior by reacting to the rate of change of the process variable. When external disturbances cause rapid fluctuations, increasing the derivative value enhances the system’s ability to respond quickly, helping it recover to the setpoint more rapidly. Conversely, decreasing the derivative value results in a more gradual response, reducing potential overshoot and oscillations caused by sudden changes. Proper adjustment of the derivative helps stabilize the control loop during abrupt process variations, ensuring smooth and responsive operation.

1.5 Derivative.
PV Setpoint Deviation (min and max)
The PV (Process Variable) (image 1.6) setpoint deviation setting allows the user to adjust how sensitive the control system is to deviations from the target setpoint. Lower values restrict the system to respond more precisely when the PV is very close to the setpoint, making it highly reactive to small fluctuations. Higher values widen the acceptable range and reduce the system’s reaction to minor changes, resulting in a more gradual and stable response.
Since each station may have different configurations and operational characteristics, adjusting this setting provides a customizable way to calibrate the control loop. It ensures the station operates smoothly and efficiently, tailored to its specific build and process requirements.

1.6 Setpoint deviation
Panel Temperature Settings
Monitoring panel temperature is essential to maintain reliable operation of electrical components (image 1.1). Extreme heat or cold accelerates component degradation and can cause malfunctions that affect communications and overall panel performance. The PLC includes a dedicated analog input for the panel temperature sensor—use this input to monitor and alarm on out-of-range conditions to protect the equipment.
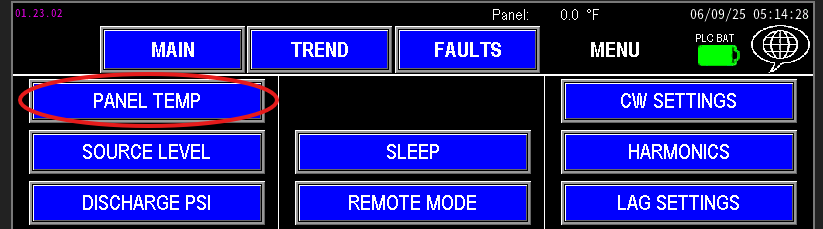
1.1 Panel temp
Temperature settings screen
The panel screen provides fields to configure the temperature monitoring parameters (image 1.2). In the top-right corner you will see the live panel temperature readout. Use the configuration fields on this screen to set alarm thresholds, scaling, and any delays required for alarm logic.
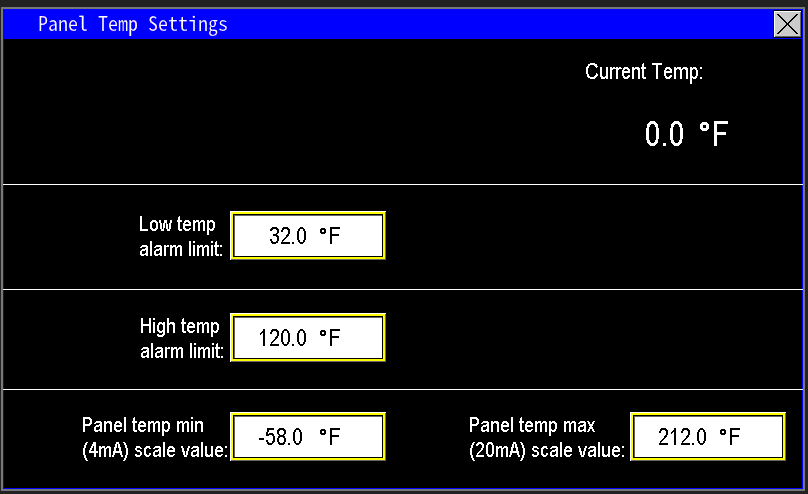
1.2 Panel Temp screen
Low temp and high temp alarm limit
Set the low and high temperature alarm limits (image 1.3) to reflect the panel’s optimal operating range and the environmental conditions it is exposed to. For example, in the illustration the panel will trigger a low‑temperature alarm below 32°F and a high‑temperature alarm above 120°F. These alarms do not power the panel on or off; they notify operators and protect internal components by prompting corrective action when temperatures move outside the defined safe range.
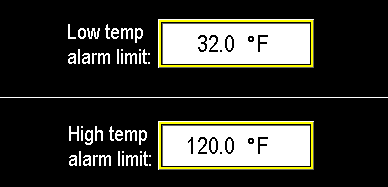
1.3 Low temp and high temp alarm
Transmitter scaling
If the RTD or temperature transmitter is replaced with a unit that has a different span, update the PLC scaling to match the new device. Enter the transmitter’s minimum temperature (corresponding to 4 mA) into Panel Temp Min (4 mA) and the transmitter’s maximum temperature (corresponding to 20 mA) into Panel Temp Max (20 mA). This ensures the HMI displays correct temperature readings (image 1.4).

1.4 Transmitter scaling
Password Protection
To prevent unauthorized changes while the station is unattended, configure a password under the Password tab (image 1.1). Enabling a password locks access to HMI screens and settings, protecting the system from inadvertent or incorrect adjustments by untrained personnel.
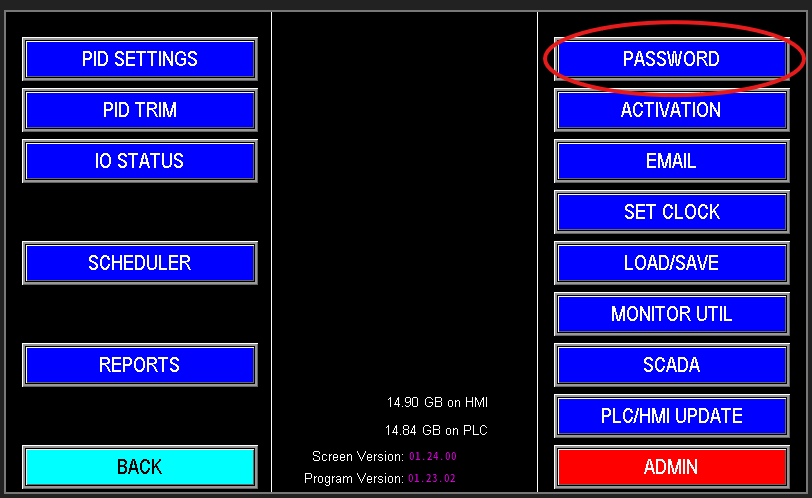
1.1 Password Tab
When you enter the Password screen you are immediately prompted to create a password (Image 1.2). Enter the desired password and press Enter. The screen will then display the password protection status and allow you to enable or disable password protection (Image 1.3).
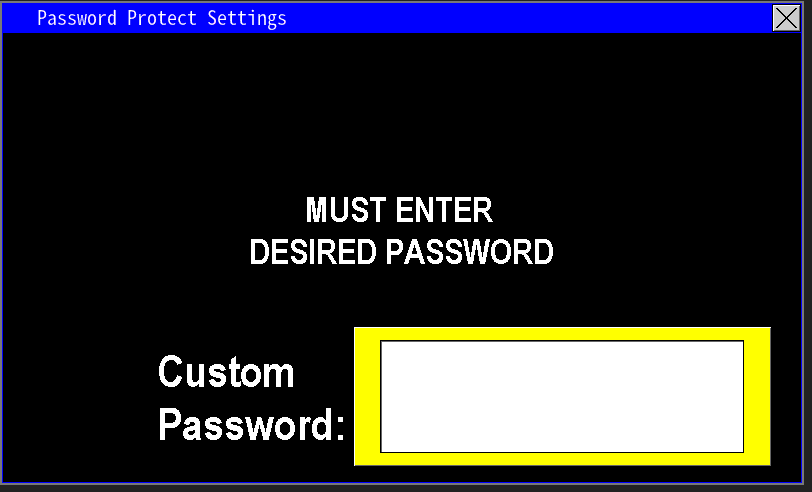 1.1 Enter password |
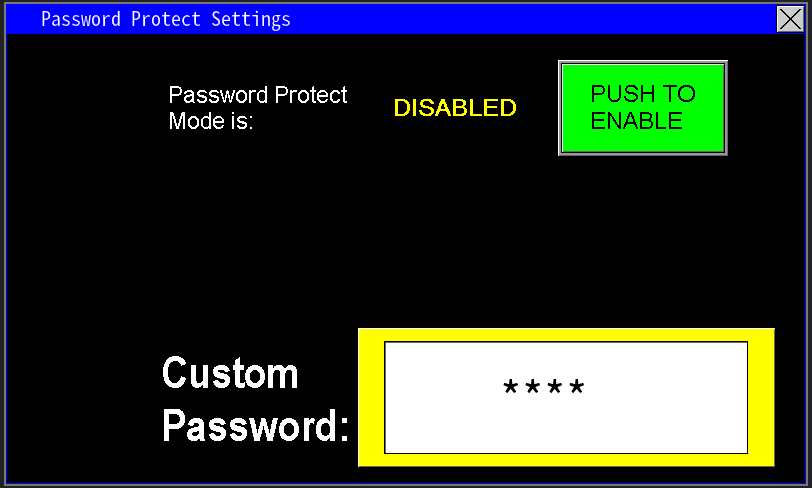 1.3 Password entered and not enabled |
When password protection is enabled, the HMI returns to the menu screen. Navigation remains available, but any attempt to modify settings requires reentry of the password. The screen will automatically relock after a few minutes of inactivity, requiring the password again.
To disable password protection, return to the Password screen and select “Push to Disable.” You will be prompted to enter the password; after entering the correct password, confirm the disable action. Password protection will then be removed and settings will be accessible without authentication.
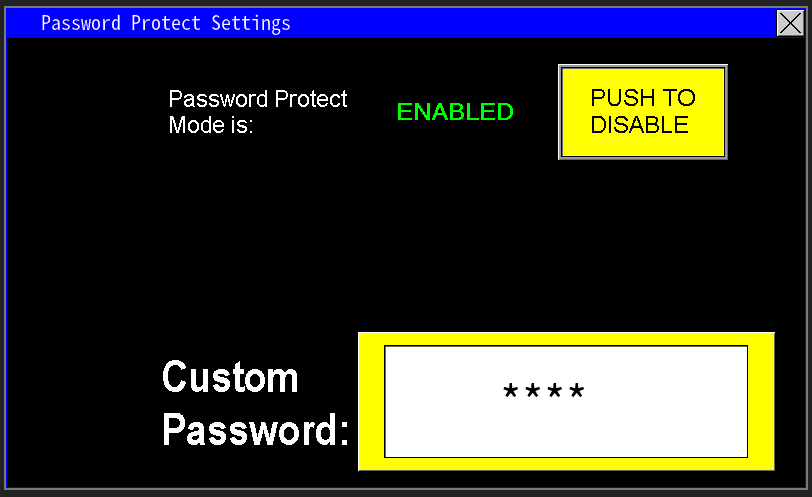
1.4 Password enabled
Prime Loss
Prime Loss (image 1.1) applies to stations with a suction‑lift intake. It monitors whether pumps retain water in the volutes while the station is idle. This feature requires a wet/dry switch. If the wet switch indicates dry (or the pumps lose prime), the station will return to priming mode.
To verify wet‑switch status, check the main screen next to each pump (Image 1.2): “Wet” indicates ready for normal operation; “Dry” indicates the pump must reprime before starting.
 1.1 Prime Loss |
 1.2 Wet Switch |
Prime Loss Settings
Prime Loss uses three parameters: Prime Loss Delay, Prime Loss Restart Trials, and Prime Loss Restart Delay (image 1.3).
- Prime Loss Delay: time between detecting a dry wet‑switch and declaring a prime‑loss fault.
- Prime Loss Restart Trials: number of automatic fault/restart attempts allowed for a prime‑loss condition.
- Prime Loss Restart Delay: time the station remains faulted before attempting an automatic restart.
Example: when the wet switch goes dry, the PLC starts a 30‑second Prime Loss Delay and faults. The station remains faulted for 1 minute (Restart Delay) then attempts a restart. This cycle repeats up to 6 restart trials; if the condition persists, the station latches a hard fault and requires on‑site inspection.

1.3 Prime Loss settings
Reports
The Reports tab tracks water usage through the station for operational monitoring or regulatory reporting (image 1.1). It displays daily totals and historical data for previous days, making it easy to review consumption trends. Report data can be exported or emailed to stakeholders as needed.
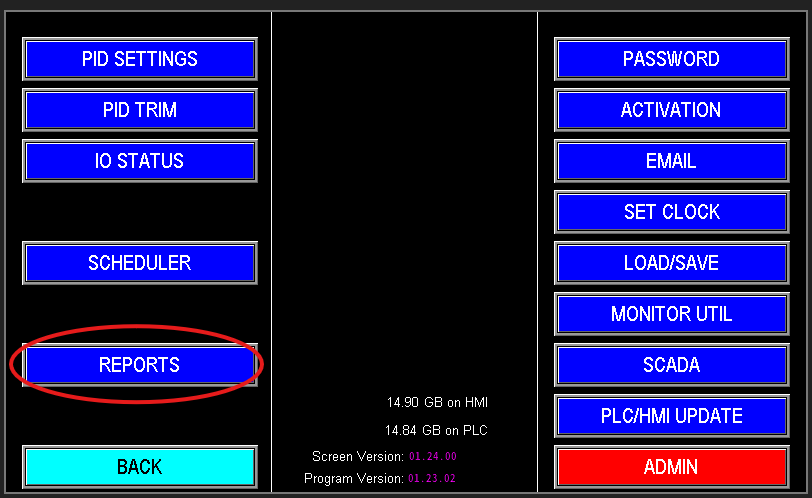
1.1 Reports
Monthly Totals Screen
This screen (image 1.2) displays monthly water usage totals. It presents the total flow for each month and, where applicable, includes separate totals for well flow. If a rain gauge is installed, monthly precipitation totals are also recorded.
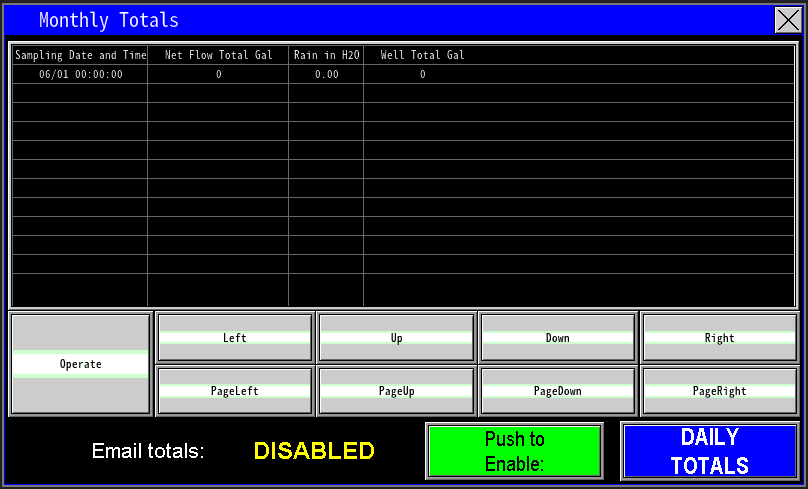
1.2 Reports screen
Operate
The Operate button (image 1.3) enables interaction with the navigation and command keys. When “Operate” is displayed, navigation and command keys are locked. Pressing the Operate button clears the label and unlocks the screen, allowing navigation with the arrow and command keys.
The other buttons next to the operate button allow for navigation of the total lists (image 1.4).
1.4 Navigation
The lower portion of the screen (image 1.5) displays whether automated reporting is enabled or disabled, and provides access to the Daily Totals report. When reporting is enabled, the system will automatically email summarized flow totals by day and by month to designated recipients.
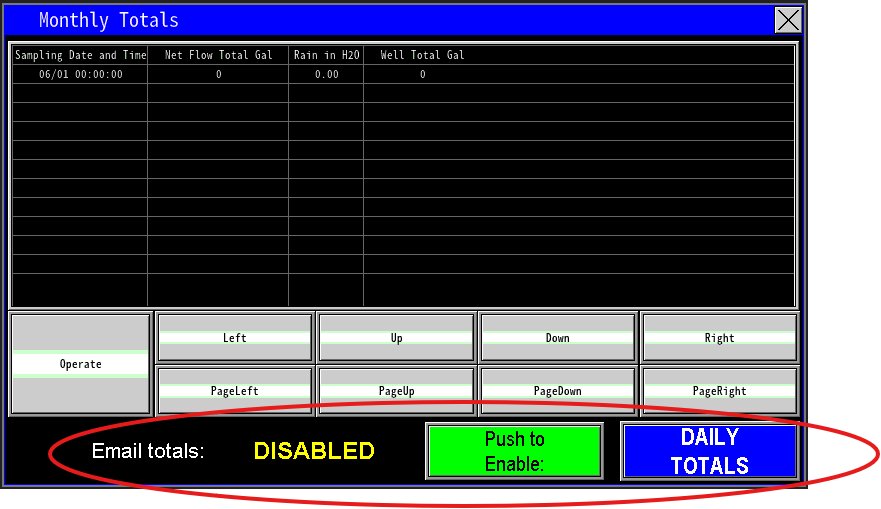
1.5 Emails
Daily Totals
Select the Daily Totals button in the bottom‑right corner (Image 1.7) to open the Daily Totals screen (Image 1.8). This view provides the same flow information as the Monthly Totals screen but displays it broken down by individual days instead of by month.
 1.6 Daily Totals |
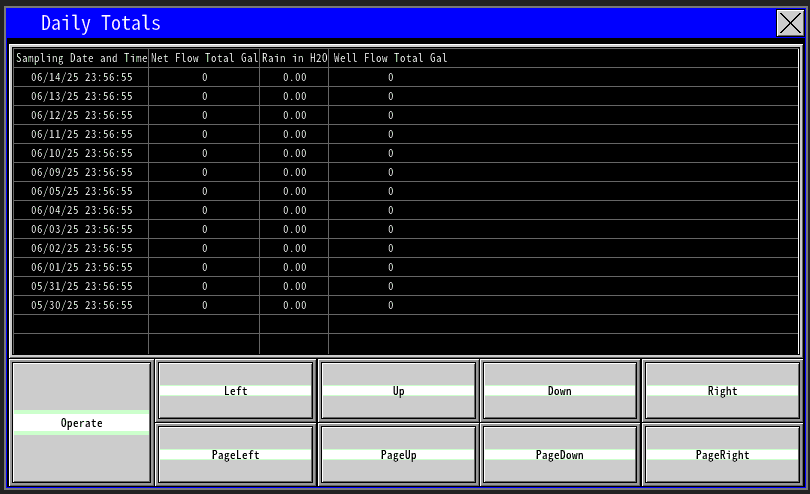 1.7 Daily totals screen |
SCADA
SCADA provides communication and supervisory control across distributed controllers and sites (image 1.1). It enables controllers to share status and process data so systems that depend on remote inputs can operate correctly. Use the SCADA configuration to establish connections, map required tags between controllers, and ensure reliable data exchange for monitoring and coordinated control.
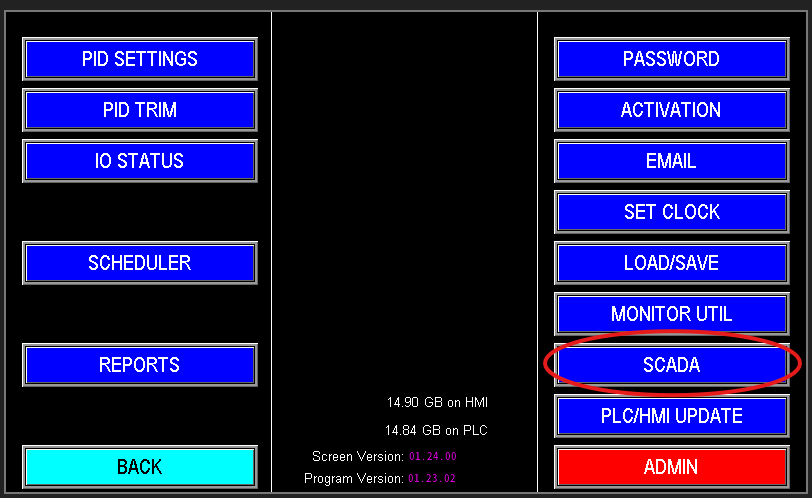
1.1 SCADA
SCADA Settings
On the SCADA screen is where this communication is set up, and we will go over what some of these options do (image 1.2).
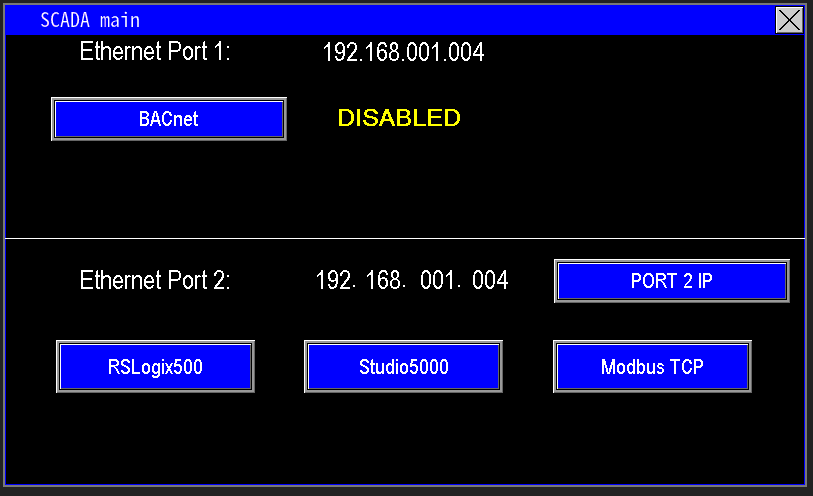
1.2
BACnet (Ethernet Port 1)
BACnet (Building Automation and Control Network) is an open communication protocol that enables interoperability between automation systems from different manufacturers. Enabling BACnet opens a gateway for data exchange between Omnia and other BACnet‑compatible controllers (image 1.3).
To configure BACnet in Omnia, enter the BACnet settings screen and follow the on‑screen instructions shown in Image 1.4 to enable and set up the BACnet features.
 1.3 BACnet |
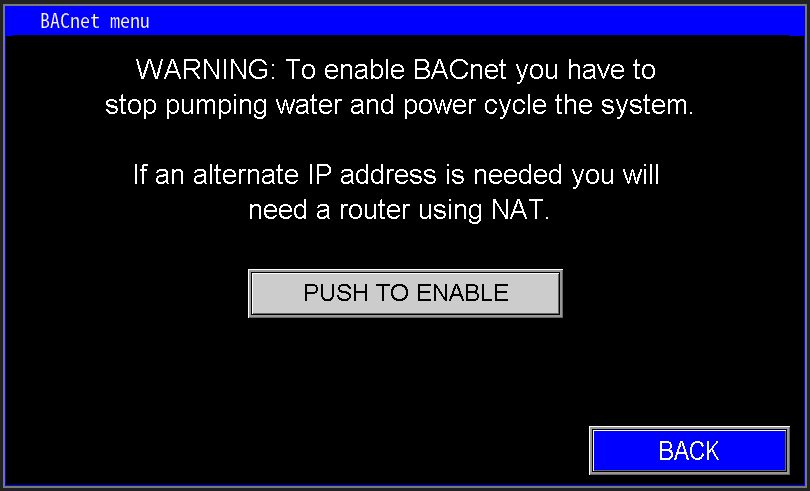 1.4 BACnet Settings |
RSLogix500, Studio5000, and Modbus TCP (Ethernet Port 2)
This section (image 1.5) configures how the panel exposes data to SCADA:
- Port 2 IP: sets the fixed IP address used for SCADA communication on Ethernet port 2.
- RSLogix500 / Studio5000 / Modbus TCP buttons: display the register/address mappings and protocol specifics SCADA systems should use to read tags from this panel.
Use these mappings to point your SCADA or PLC program to the correct registers and network endpoint for reliable data exchange.

1.5 Ethernet port 2
Ethernet Port 2
The standard with PPS is to use 192.168.1.4 as the PLC IP address. Port needs to change, enter into the port 2 screen (image 1.5).
1.5 Port 2 IP
When you open the SCADA network screen you have three configuration modes:
- Internal PLC Settings (Image 1.6): uses the PLC’s built‑in Ethernet settings for communication.
- Dynamic IP (DHCP) (Image 1.7): lets Port 2 obtain an IP automatically from the network DHCP server so the panel takes an available dynamic address.
- User‑Defined (Static) (Image 1.8): lets you specify a fixed IP address for Port 2. Use this when a static address is required for SCADA connectivity.
Notes:
- Use DHCP for ease of integration when your network supports dynamic addressing.
- Use User‑Defined (static) when SCADA requires a persistent IP or when network policies demand fixed addressing.
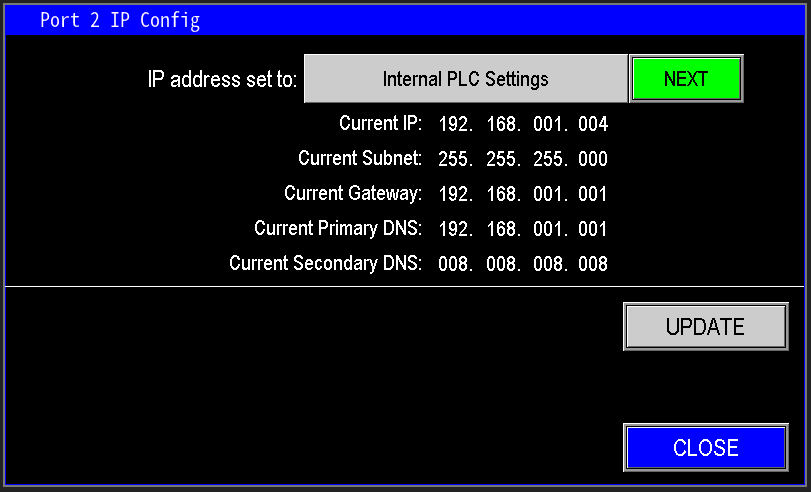 1.6 Internal PLC Settings |
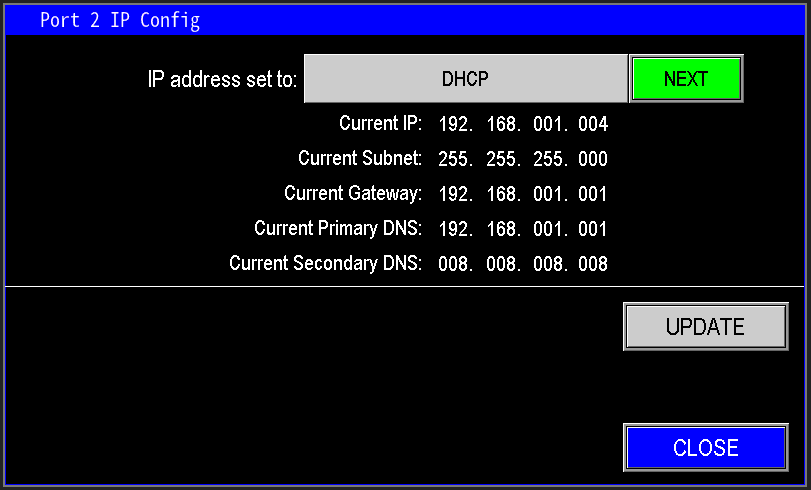 1.7 Dynamic IP settings |
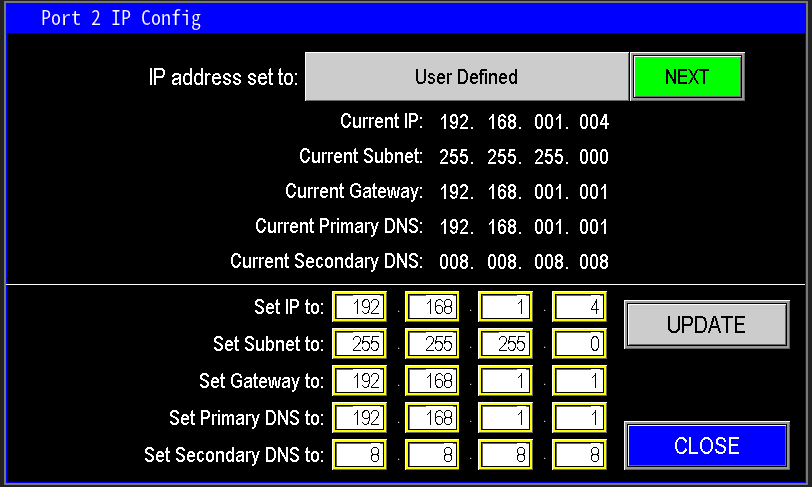 1.8 User defined |
RSLogix500
To configure RSLogix500 communications with the Omnia program, click "RSLogix500" (Image 1.9).
1.9 RS500
Then implement the ladder logic in RSLogix500 as shown in Image 2.0, following the provided instruction sequence to map and exchange tags with the Omnia panel.
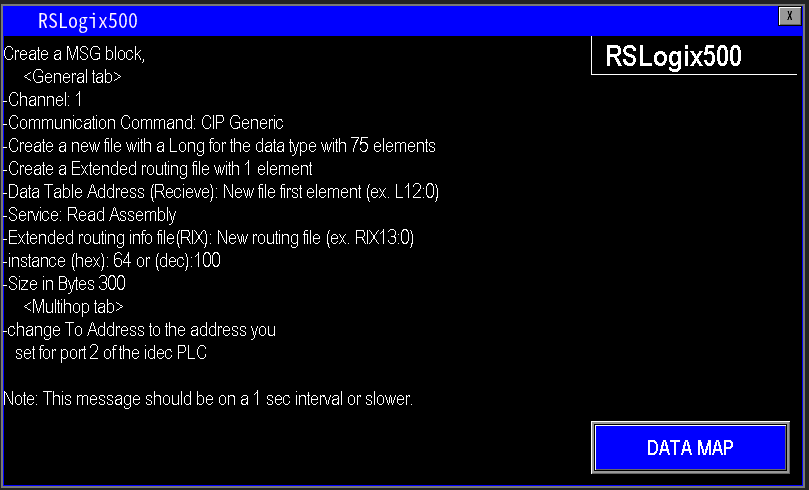
2.0 RSLogix programming
After updating the PLC with the required communication logic, the data map (Image 2.1) shows each populated tag and its meaning. Configure your RSLogix500 program to reference these data elements.
Note: All mapped data values are provided as DINTs.
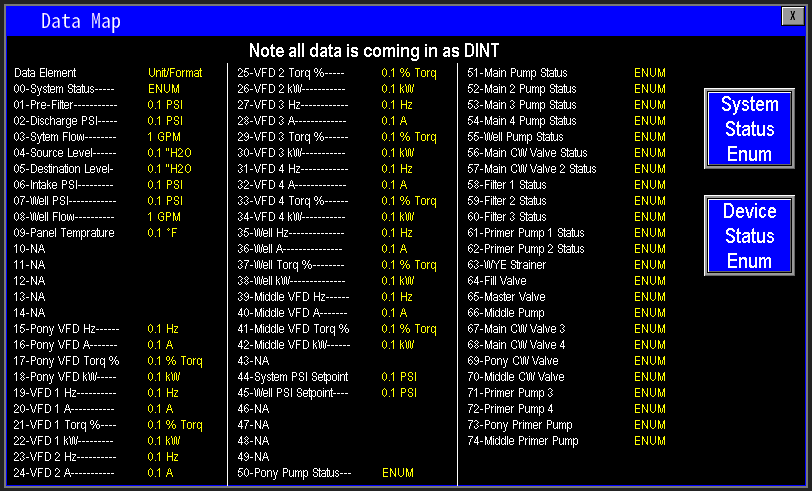
2.1 RS Data Map
View System Status Enum Bits (Images 2.2–2.3)
Open the System Status Enum page to view all status bits. Use the data map to identify the specific bits required and target those bits within your RSLogix/Studio 500 ladder logic to integrate and control the system.
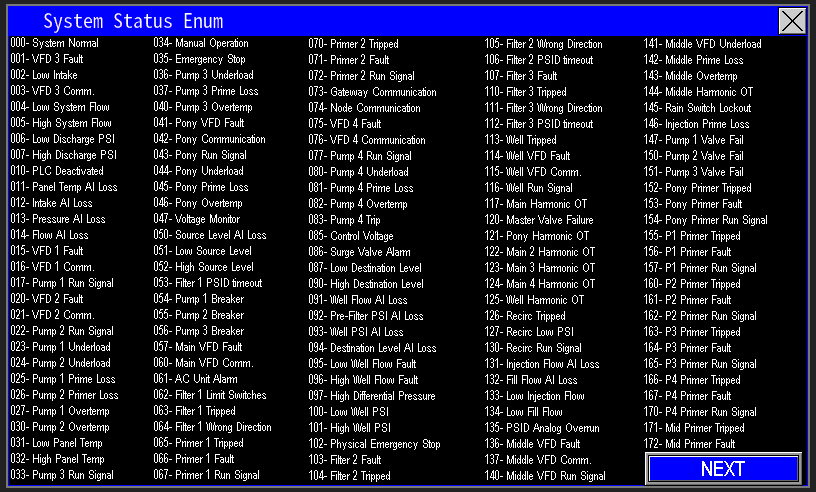 2.2 System Bits 1 |
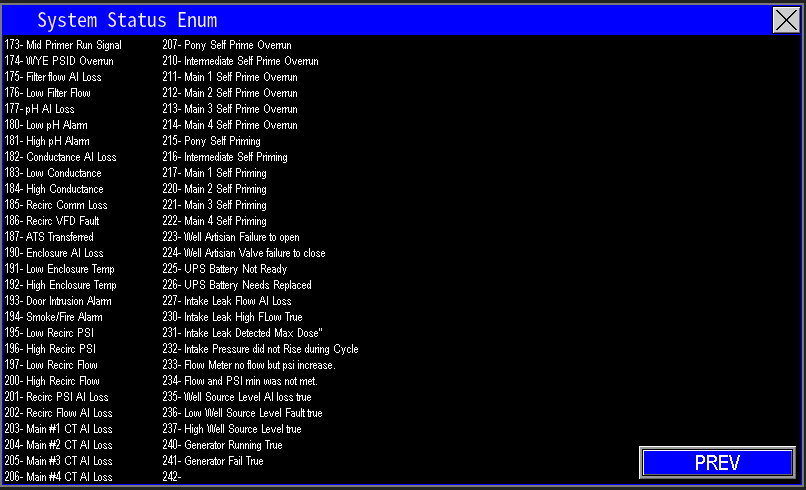 2.3 System bits 2 |
Device Status Enum Bits (Image 2.4)
Open the Device Status Enum screen to view all device status bits. Identify the specific bits required for your application and reference them in your ladder logic to integrate device-level status into your control program.
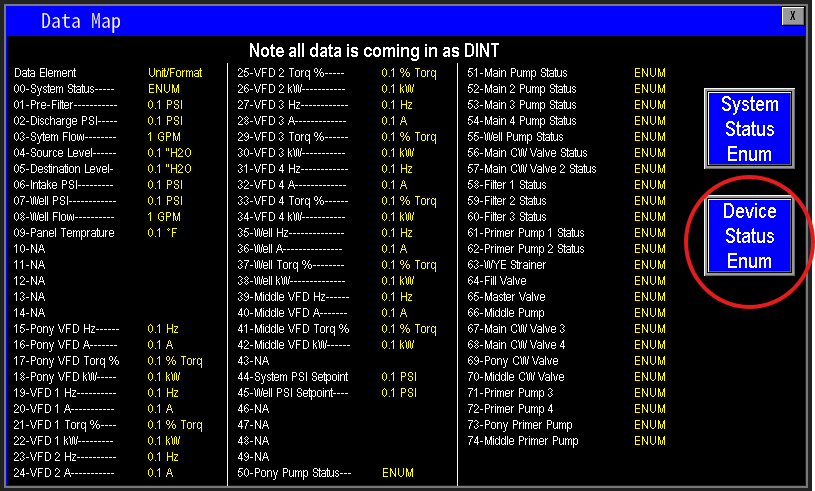
2.4 Device enum
Studio5000
To configure Studio 5000 communications with the Omnia panel, click "Studio5000" (Image 2.5). Follow the on‑screen instructions to import the tag/address mapping and implement the required logic in your Studio 5000 project.
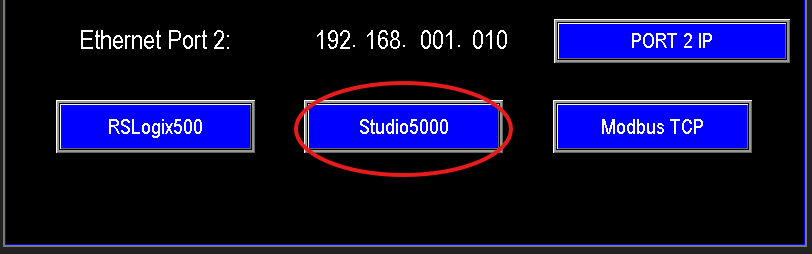
2.5 Studio 5000
Implement the Studio 5000 logic as shown in Image 2.6, following the provided instruction sequence to map and exchange tags with the Omnia panel.
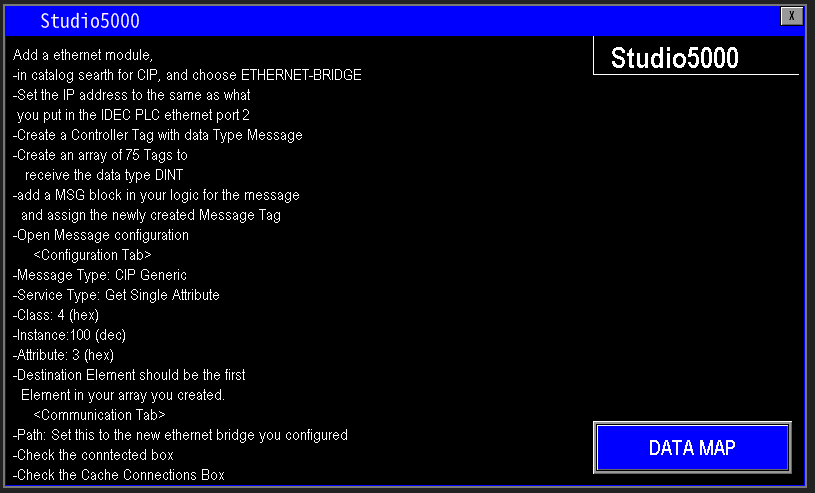
2.6 Studio Programming
After updating the Studio 5000 project with the required communication settings and ladder logic, consult the data map (Image 2.7). It lists every populated tag and its meaning—use this map to reference and target the required data elements in your program.
Note: All mapped values are provided as DINT.
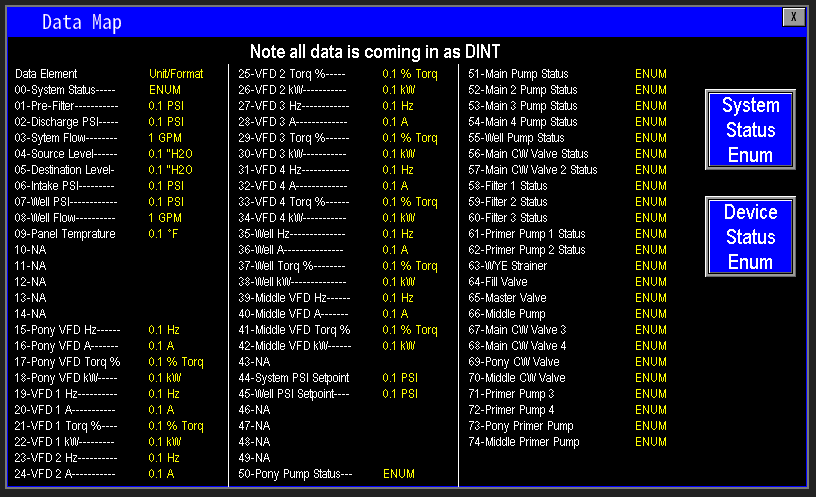
2.7 Data Map
System Status Enum Bits (Images 2.8–2.9)
Open the System Status Enum pages to view all status bits. Identify the specific bits required for your application and reference those bits in your Studio 5000 logic to integrate system‑level status into your control program.
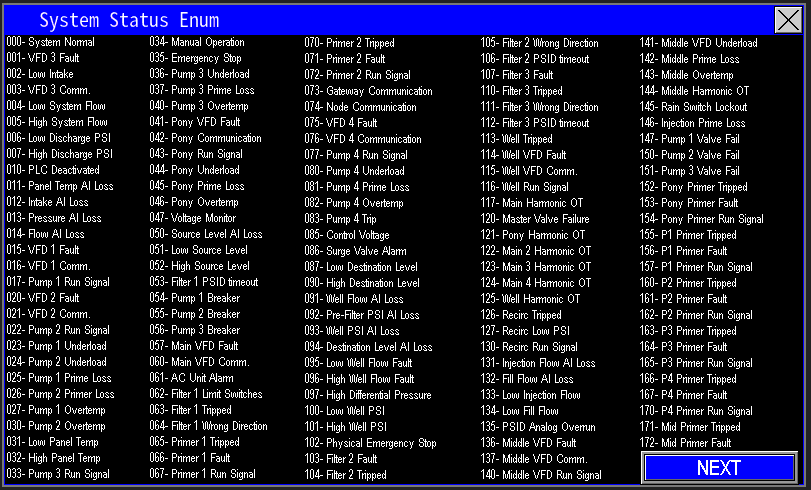 2.8 System bits |
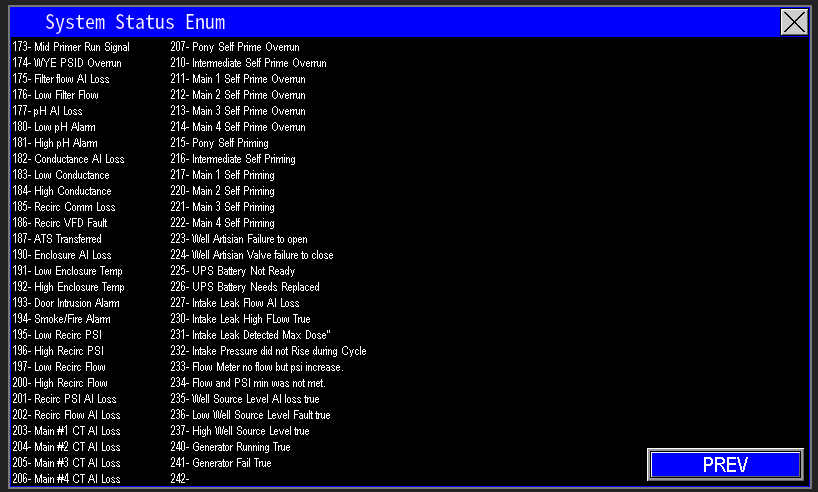 2.9 System Bits 2 |
Device Status Enum Bits (Image 3.0)
Open the Device Status Enum screen to view all device status bits. Identify the specific bits required for your application and reference them in your control program. Map the selected bits into your logic and implement the necessary ladder/function block code to monitor and respond to those device states.
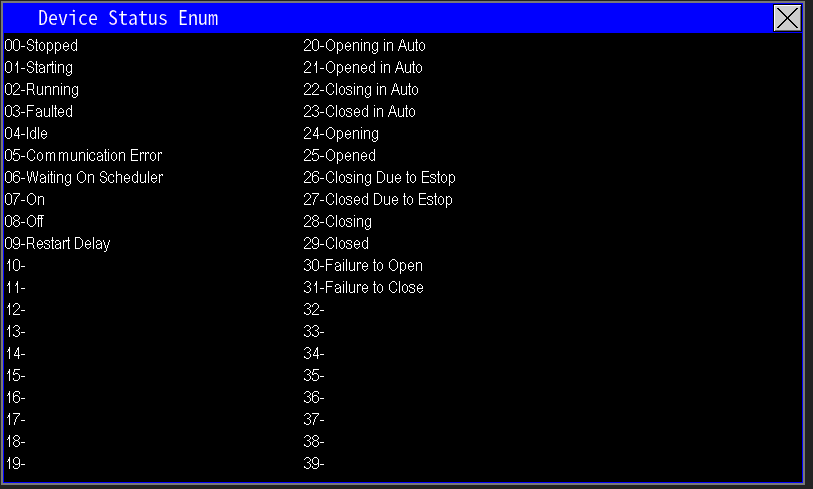
3.0 Device status bits
Modbus TCP
Click "Modbus TCP" (Image 3.1) to open the Modbus TCP configuration and mapping interface. This screen provides the register mappings, function codes, and network settings required to expose Omnia tags over Modbus TCP for SCADA or other Modbus masters. Configure the IP/port, unit ID, and mapping per your SCADA requirements, then apply and test communications.
3.1 Modbus TCP
Once the Modbus TCP configuration and required logic are in place, consult the data map (Image 3.2) for the populated registers and their meanings. Use those Modbus addresses in your SCADA or PLC program to read/write the required values.
Note: All mapped data is provided as DINT.
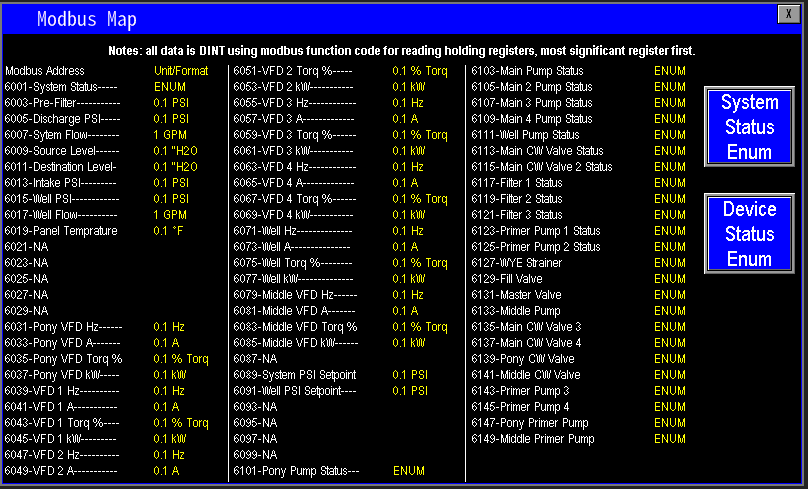
3.3 Data Map
System Status Enum Bits (Images 3.4–3.5)
Open the System Status Enum pages to view all status bits and their meanings. Identify the specific bits your SCADA or controller needs, then reference those bits in your program to monitor and respond to system-level conditions.
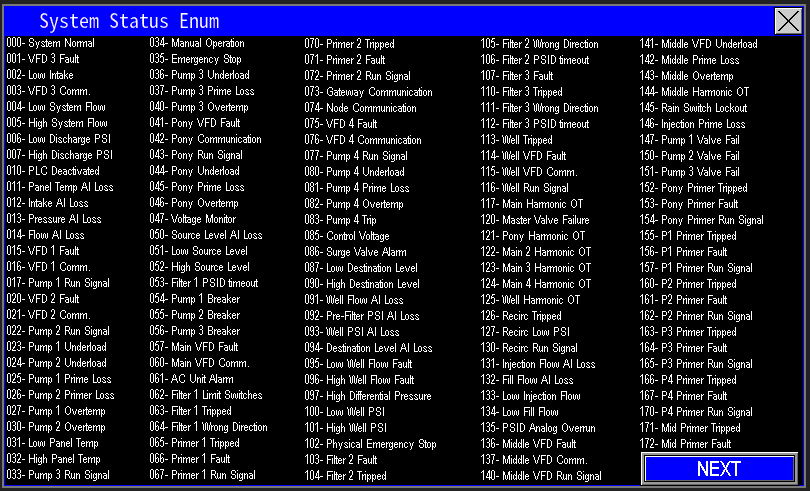 3.4 System Status Bits |
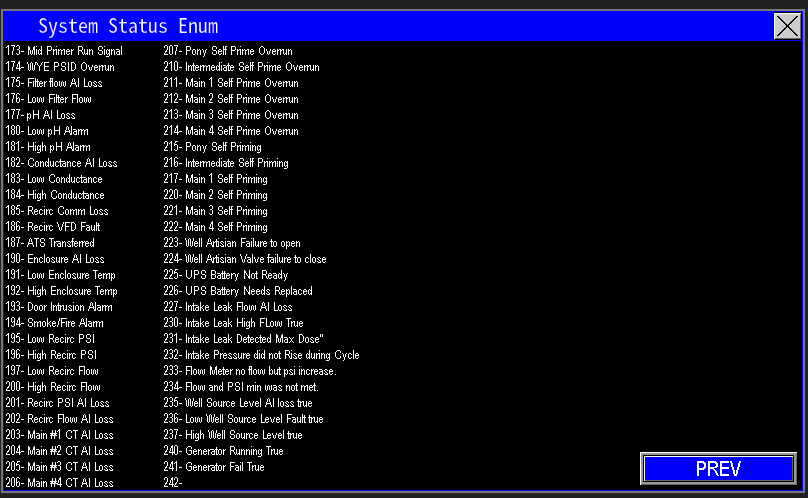 3.5 System Status Bits 2 |
Device Status Enum Bits (Image 3.6)
Open the Device Status Enum screen to view all device status bits and their definitions. Identify the bits required for your application, then map and reference them in your control or SCADA program to monitor and respond to device-level conditions.
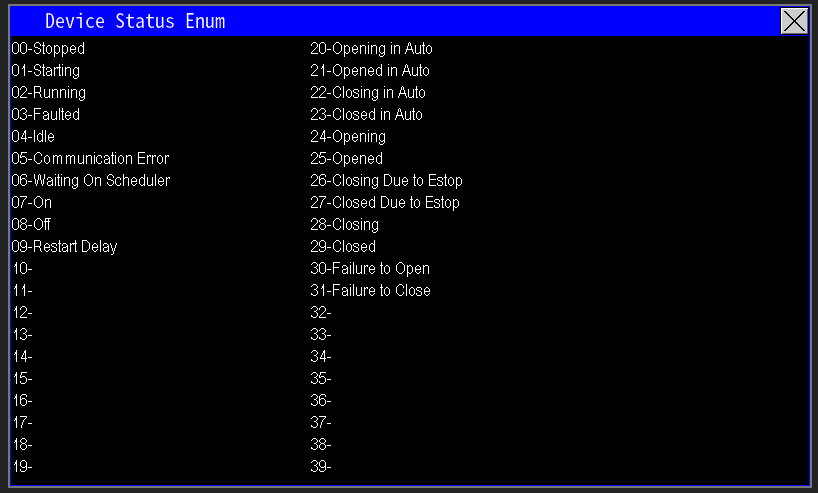
3.6 Device status bits
Scheduler
The scheduler functions like a standard irrigation controller but is integrated into Omnia for easier setup and management (image 1.1). Use it to automate station run times and restrict operation during specified times of day. Configure schedules, enable/disable events, and set time windows so the station only runs when permitted.
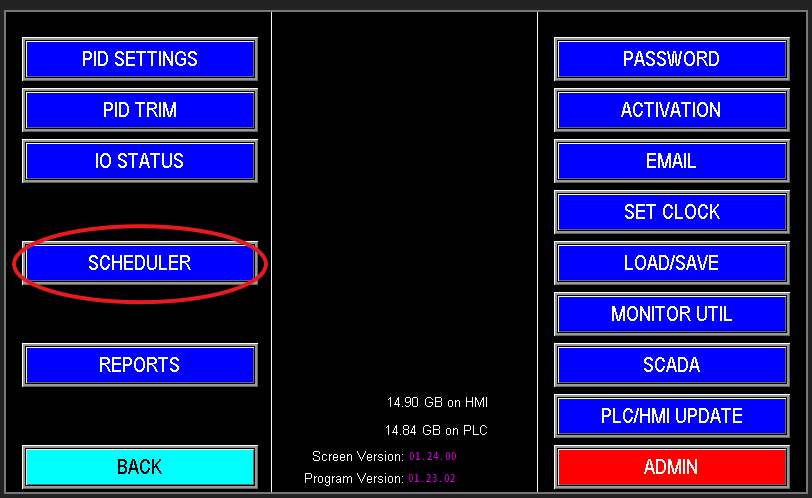
1.1 Scheduler
The scheduler provides flexible, customizable automation to control when the station runs and which pumps operate. There are three identical scheduler profiles to configure separate schedules as needed. The scheduler interface (image 1.2) is organized into several sections to simplify setup and ensure precise control of station runtime and pump selection.

1.2 Scheduler
Scheduler select
This section allows you to choose among multiple predefined schedules (image 1.3). If operational rules change—for example, permitting additional watering—select an alternate scheduler and configure the new run times. You can also use this area to schedule auxiliary functions, such as operating a water feature at specified times.

1.3 Scheduler select
Scheduler Status
This section displays the currently selected schedule, its enabled/disabled state, and its real‑time status (image 1.4). For example, if Scheduler #1 is selected and enabled but shows “Off,” it is awaiting its configured start time and will activate according to its schedule when that time is reached.

1.4 Scheduler Status
Scheduler run time setup
Use this section to configure the exact times the station will run—similar to programming a sprinkler controller. Before configuring, verify the HMI date and time are correct, as the scheduler operates from the panel clock (image 1.5).
- Each scheduler supports two start times per day.
- Select the desired start times and the days of the week the schedule should run.
- If more than two daily start times are required, use the additional scheduler profiles to add
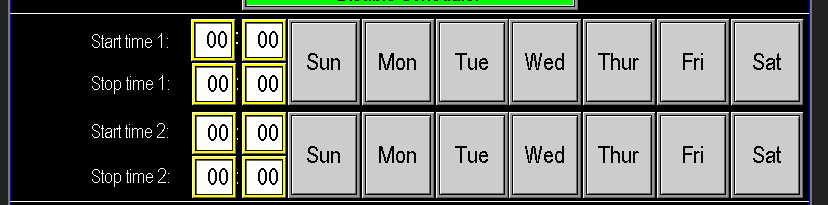
1.5 Time and Days
Devices to run
Select which pumps should run for the configured schedule (image 1.6). For each scheduler cycle, choose the device(s) (e.g., Main1, Main2, Jockey) that will operate. For example, if a single main pump can supply a zone, select only that pump for the schedule. If no devices are selected, no pumps will run for that scheduled event. Ensure device selections are configured during station setup.

1.6 Devices to run
Scheduler Example
Example Scheduler Configuration (Images 1.7–1.8)
Scheduler 1
- Enabled, Status: Off
- Start Time 1: 16:57 — End Time: 23:20 on Mon, Wed, Fri
- Start Time 2: 04:00 — End Time: 13:00 on Sun, Tue, Thu, Sat
- Devices: Jockey, Pump 1, Pump 2
Scheduler 2
- Active now
- Different start/end times and days for a smaller zone
- Devices: Pump 3, Pump 4 (jockey and Pumps 1–2 not selected)
Note:
- Start and end times must be within the same calendar day. A schedule that spans midnight will stop at 00:00 of the start day (e.g., 20:00 → 03:00 will run 20:00–00:00 only), so plan schedules accordingly.
1.7 Scheduler 1 |
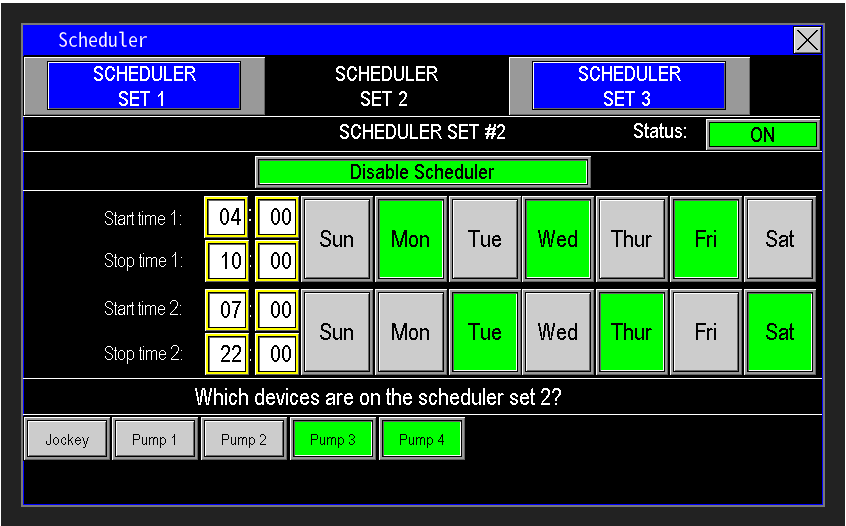 1.8 Scheduler 2 |
Bypass Scheduler
The Bypass Scheduler feature allows temporary override of an enabled schedule without disabling or editing it (image 1.9). When the scheduler is active but not calling for pumps, press Bypass Scheduler to open the bypass dialog. Select the scheduler to override and specify the bypass duration.
Example image 2.0: Bypassing Scheduler #1 for 3 hours will permit pump operation for that interval while leaving the original schedule unchanged.
 1.9 Bypass Button |
 2.0 Bypass screen |
Set Clock
To edit the system time and date, select "Set Clock" to open the clock setup screen (image 1.1). All emails, records, and event timestamps use this HMI time — ensure the date and time are set correctly.
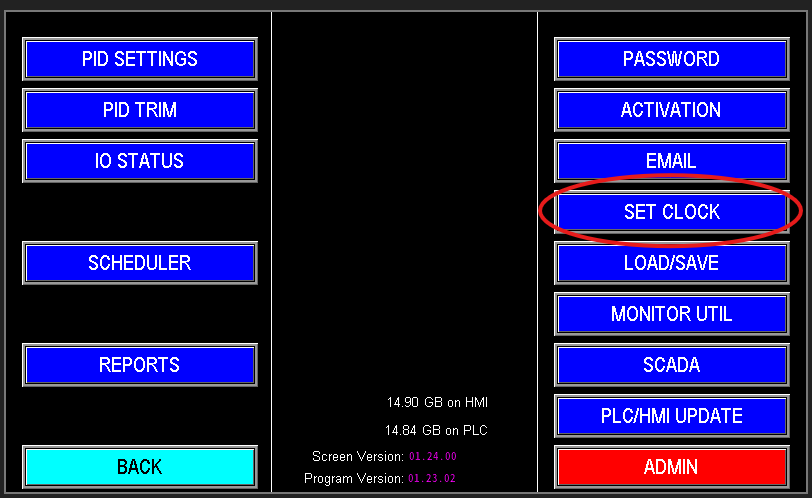
1.1 Set Clock
Set Clock — Date & Time Entry (Image 1.2)
Enter the date (MM/DD/YY) and time using the 24‑hour format. After completing all fields, press "Update Clock" to apply the new values.
Note: All fields (date and time) must be filled before updating; partial entries will not be accepted.
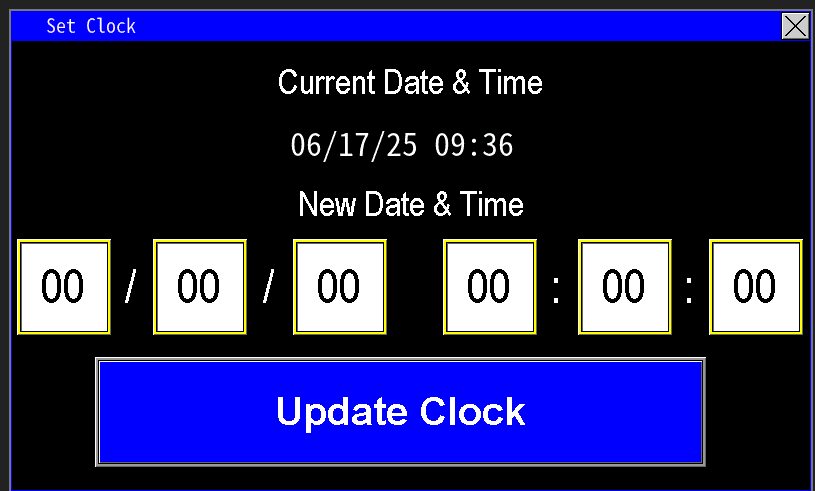
1.2 Set Clock
Service and Troubleshooting
For automation issues, consult the Fault Screen first to identify the fault and begin diagnosis. The Diagnostics tab provides detailed information useful for troubleshooting automation problems and locating corrective actions. Use this manual as your primary troubleshooting resource to track faults, identify likely causes, and follow recommended remedies. If the issue cannot be resolved promptly, contact PPS Service for further assistance.
Trend Screen
The Trend Screen serves as the central data management hub for the pump station, providing comprehensive access to both real-time and historical operational data. This section enables operators to monitor current system performance, analyze past trends, and troubleshoot intermittent faults by identifying recurring patterns or root causes. Additionally, the screen allows data collection intervals and includes a USB utility for exporting data to external devices for detailed analysis.
Trend Screen Functionality
- Purpose: The Trend Screen aggregates and displays data points collected by the Programmable Logic Controller (PLC), including motor data, system pressure, tank level, and other key parameters.
- Historical Review: Operators can navigate historical data to investigate intermittent faults or performance issues. By reviewing past data points associated with fault occurrences, the root cause can be identified through common denominators (e.g., specific pressure drops or level changes).
- Interval Scan Time Adjustment:
- Description: Allows operators to modify the frequency of data collection.
- Function: Provides flexibility to increase precision with shorter intervals for detailed analysis or use broader intervals to capture long-term trends, optimizing data storage and processing.
1.1 Trend Screen
USB Utility (Image 1.2)
- Purpose: The USB Utility feature enables data export from the pump station’s memory card to an external USB storage device for offline analysis.
- Access: Initiated via the USB Utility button on the Trend Screen.
- Operation:
- Insert a USB stick into the port located on the front panel of the control unit.
- Press “copy” on any of the Data information desired for analysis and the data is then automatically transferred from the internal memory card to the USB stick.
- Press the “Stop USB for Removal” button to safely complete the transfer process.
- Remove the USB stick and connect it to an office computer or laptop for data evaluation.
- Benefits: Facilitates detailed review of trend logs and operation logs when on-screen navigation is challenging or time-consuming.
- Data Clearing: After extracting necessary data, operators may select “Clear Trend and Operation Logs from SD Card” to erase stored data from the memory card, if desired.
The Trend logs contain the data points recorded by the PLC, including but not limited to motor data (e.g., speed, amps), system pressure, and tank level
Operation logs document operator-initiated actions, such as switching a motor to Hand or Auto mode, or manually energizing a valve.
Alarm Log is a comprehensive list of all the Alarms and faults the station has had.

1.2 USB Data
Faults Screen
The Fault Screen provides a comprehensive historical record of faults that have occurred within the pump station, enabling operators to track, analyze, and resolve issues effectively. This section is designed to assist in diagnosing system problems by organizing fault data into distinct categories and offering navigation and diagnostic tools. Proper use of this screen ensures timely identification and correction of operational faults, maintaining system reliability.
The Fault Screen (image 1.1) is divided into three primary data sections, with additional navigation controls located below the fault list.
Fault Data Sections
- Occurrence:
- Records the date and time when each fault was detected.
- Provides a chronological reference to pinpoint when the fault occurred, aiding in correlating events with operational conditions.
- Message:
- Displays the name of the fault (e.g., Low Pressure, Pump Overcurrent).
- Identifies the specific issue, allowing operators to quickly recognize the nature of the fault for further investigation.
- Recover:
- Indicates the date and time when the fault was manually reset or auto-reset by the system.
- Tracks the resolution timeline, helping operators verify when normal operation was restored.
Navigation Controls
Below the fault list, the following buttons facilitate interaction with the fault data:
- Select:
- Enables selection of a specific fault from the list for detailed review.
- Highlights the chosen fault, preparing it for diagnostic analysis or other actions.
- Up and Down:
- Provides scrolling functionality to navigate through the fault list.
- Allows operators to move to previous or subsequent faults, ensuring access to all recorded events.
- Diagnose:
- Appears after selecting a fault, opening a detailed description of the occurrence.
- Offers operator guidance by providing common troubleshooting suggestions and potential fixes specific to the selected fault, enhancing resolution efficiency.
- Clear:
- Erases all faults currently displayed in the fault list.
- Permanently removes selected fault records. Use with caution, as cleared data cannot be recovered.
Alternative Selection Method
- In addition to using the “Select” button, operators can choose a fault for investigation by directly pressing the fault message in the list.
- Once selected, proceed by clicking the “Diagnose” button to access the associated diagnostic information as described above.

1.1 Faults
Diagnose
The Diagnose button provides detailed fault insights. Pressing it brings up the Diagnose screen (image 1.2), which offers guidance on resolving the issue.
- Source: The current fault identified
- Indication(s): Possible causes of the fault
- Resolution(s): Suggested actions to fix the problem

Omnia Program Version Updates
Versions
This section provides release notes for the different versions of the Omnia HMI software. The versioning format is xx.xx.xx:
- The first number represents a hardware configuration and can be ignored for software purposes.
- The second number signifies a major revision that requires an update of both the PLC and HMI.
- The third number indicates a minor revision that does not require a PLC update.
Version 1.23.xx
1.23.01 (May 23, 2025)
- Fixed a name change error. Pony to Jockey
1.23.00 (May 9, 2025)
- Removed the part that has clarity shut off emails, this was originally removed on Hunters end, but it seems that it may have reverted. In short Local emails no longer “turns off” but rather you can remove yourself from the list. Worst case scenario is you will get some duplicate emails.
- Added a offset to the Level sensors. This will be so that the level will display accurately in tank scenarios where the transmitter is not on the bottom.
- I removed Self Prime from the fault log and the system status, that way it will not fill up the log. Instead I am trending the data in the background on a file so that I can cross ref incase of problem. It may need to be added to individual pump status’s but that is a large overhaul involving clarity as well.
Version 1.22.xx
1.22.00 (April 7, 2025)
- Automation organizer upgraded to version 040900
Version 1.21.xx
1.21.00
- Added ACS380 as an option for the drive
- Added a extra mode to flow cutout for Jockey and Intermediate pump that will allow them to stay off until all pumps are asleep or pressure drops and flow is low.
Version 1.20.xx
1.20.01
- Fixed visibility for the recirc pump to be tied to the recirc main visibility instead of the run signal. Affected items: Schedulers, altitude valve follower.
1.20.00
- Added the ability to invert all of the pump overtemp signals and the seal fail signals in the admin area.
Version 1.19.xx
1.19.00
- Added the ability to allow the pumps to alternate even if they don’t go to sleep in the admin area.
- Removed a bunch of useless stuff from the admin config area.
Version 1.18.xx
1.18.05
- Fixed the pre-wye psi from not showing up when 4 or more analog devices were configured on a 5 inch and 8 inch screen.
1.18.04
- Fixed the derivative of the intermediate pump.
1.18.03
- Fixed a misspelling.
1.18.02
- Had the disch and the intake psi swapped in 2 spots, fixed min psi text to be correct.
1.18.01
- Fixed PRE-WYE- PSI so that it would show up in the menu
- Fixed pre-wye psi scaling addresses.
1.18.00
- Changed Pony to say Jockey
- Added a switch on the drive page so that you could state that the speed ref comes from the HMI
Version 1.17.xx
1.17.01
- Fixed some visibility bugs with the well PID setpoint
- Fixed some grammar and spelling for well PID Config screen
- Added a math equation to the input and output of the constant speed ref for the well. Before it was straight 0-1000 units which represented a percentage, now it is ((@*8)/10)+200 for the input and ((@-200)*10)/8 for the display.
1.17.00
- IDEC Firmware updates and software updates
Version 1.16.xx
1.16.00
- Optimized the lag settings which required some adjustment to the screen to accommodate the new settings.
Version 1.15.xx
1.15.01
- Added the IO in the io boxes so that the choices can be seen and chosen.
1.15.00
- Added Pre-Filter WYE strainer, the switch for intake or discharge side is on last page of configuration.
- Added a button to reset the FTP connection on the admin page.
- I forgot to add the IO to the screen for the leak detection, but I did add the Alarm information.
Version 1.14.xx
1.14.01
- Changed the Fault log to kick out the last fault instead of stop logging faults when the memory is full.
- Adjusted some objects to fit better on the screen
1.14.00
- Added Individual Prime assure functionality.
- Added pump down operation, including Source Level PID control.
- Added Seal Relay logic.
- Fixed WYE Strainer visibility bug
Version 1.13.xx
1.13.01
- Critical update that solved a new bug from Version 1.12.00 If the system is not activated, and the 1-hour activation popup triggers, the user will be stuck on the Activation message screen This can be resolved by updating the screen or going online and manually changing the value of D20020 to 1.
1.13.00
- Added Destination Level System Fill Cut in and out on the destination level page (Only when system fill mode is true)
- Added Low low and critical low to destination Level.
- Added Hand speed ref under the HOA
Version 1.12.xx
1.12.00
- Added CFS units for Main Flow
- Redid the Readout to be in ASCII
- Created flow PID Control for the main system
- For the main Pumps if you don’t select a physical HOA then it will assume a digital. ONLY FOR MAINS as for now.
- I redid all the visual addresses on the screen so that the system communication and screen run much faster. I was seeing update times taking as long as 3-4 seconds and it was very unacceptable. This solved the problem, now it is blazing fast in most places. So far, I do not see a downside
- A few minor bugs like the lower-case v on the email pop-up
Version 1.11.xx
1.11.00
- Resolved minor issue with devices 8 and 9 on main page
- Added injector pump to scheduler
Version 1.10.xx
1.10.01 (June 17, 2024)
- Resolved issue where the diagnose button redirected to the password.
1.10.00 (June 17, 2024)
- Updated Idecs Automation Organizer to AutomationOrganizer040700
- Fixed the visibility of the VFD download button
- Button Changed PORT 2 -> SCADA on MENU 2 page
- Added Bacnet in the new SCADA area
- Added Advanced button in Discharge Pressure Settings, Added setpoint adjustment by flow point in the new menu.
- Added an error popup for when the sd card or usb is missing or in the wrong plc.
Version 1.09.xx
1.09.03 (May 21, 2024)
- Fixed the button visibility on Fill Device, it was following the button, not the device address, this will not affect the functionality.
1.09.02 (May 9, 2024)
- Input enable was incorrect on the intermediate cw valve.
1.09.01 (April 5, 2024)
- Only thing that changed is the auti.ini stuff and downloading OS for OTA updates
1.09.00 (March 28, 2024)
- Added adjustable delays for the start-up and shutdown sequence of the scrubber, injector, and valve combo.
- Added the shutdown sequence for the Scrubber, Injector, and Valve Combo.
- Added Wet Switch state as an IDLE status for the Injector pump in case the wet switch is missing. This will allow for fast and efficient trouble shooting.
- Added the target GPM setpoint for the injector to the display.
Version 1.08.xx
1.08.01 (March 8, 2024)
- Changed the Email address keyboard to something specific for email addresses. Alex Garcia
1.08.00 (February 21, 2024)
- AUTOMATION ORGANIZER UPDATE 040600
Version 1.07.xx
1.07.02 (February 7, 2024)
- Updated the SCADA Fault List for the end user.
1.07.01 (February 7, 2024)
- Added the names that were missed for the IO callout
1.07.00 (February 6, 2024)
- Added Fault functionality for Gen Run and Gen Fail I realize right now that I forgot to add the io names....
Version 1.06.xx
1.06.01 (January 31, 2024)
- Fixed some visuals that were missed with the Well Level
1.06.00 (January 18, 2024)
- Added plc battery indicator function
- Added Well Source Level Analog Input (18)
- Added Well Source LLFS (213)
- Added Well Source HLFS (214)
- Fixed Low Flow alarm log indicator. Lost it from a fat finger at some point.
Version 1.05.xx
1.05.01 (December 20, 2023)
- Added 5 digits and 1 decimal to the discharge pressure, I forgot to add that to the high pressure setpoint, I may have to do that later.
1.05.00 (December 19, 2023)
- Added a min scale value for the Discharge pressure transmitter and switched the Discharge pressure to a Integer.
Version 1.04.xx
1.04.01 (December 12, 2023)
- Fixed the conversion propagations so that it looks good on 7 inch screen. Also Removed the TESTING Button
1.04.00 (December 1, 2023)
- Added the ability to separate the main drive types.
Version 1.03.xx
1.03.00 (November 29, 2023)
- Made it so that the injection system will work as a relay output based on a flow threshold only. It piggy backs on what exists.
- Minor fix on the gain and I time vis for the injector pump.
Version 1.02.xx
1.02.02 (November 17, 2023)
- Fixed the Prime assure stuff not showing up in the IO config or status.
1.02.00 (November 8, 2023)
- Added dynamic and expansive aux device capabilities. This means that the way the aux devices are displayed on the screen will be different. Instead of having a specific place on the screen, they are stacked in a specific order and stacked left to right top to bottom. This will allow us to show more details on individual devices at times and expand how many aux devices this different can handle in general.
- In menu2 and in the admin screen there is a button to access the update page. The system can now be updated with an internet connection and a USB thumb drive.
Version 1.01.xx
1.01.01 (October 24, 2023)
- Changed the HOA to be universal so that we can propagate the program from 1 application only. This will keep a high level of consistency and speed the process up significantly.
1.01.00 (October 18, 2023)
- Added Prime Assure
- Fixed a few minor bugs
Initial Release
01.00.00 (October 4, 2023)
- Initial Release